Watching the growth of digital analytics over the last several years has been both exciting and disturbing.
It’s been exciting because what was a once niche-activity has evolved into a serious, business-focused enterprise activity.
Disturbing, because many people & organizations want to compete on analytics, but are not doing the right things or adopting the right thinking about analytics.
I’ve run into organizations that don’t know how to effectively create, participate, manage or lead analysts and often believe that “data science” or the latest technology will save the day, not the team of people with different skill sets working cross-functionally to make systematic improvements.
Table of contents
- 15% Of CMO’s Don’t Measure Marketing ROI, 27% Rely On Manager Judgements
- Why “Data” Is Misunderstood, Ignored, Or Otherwise Not Acted Upon
- 1. Measuring The Journey From Prospect To Lead
- 2. Measuring Actual Customer Activity
- 3. How Well Is Your Advertising Performing?
- 4. Where Are The Leaks In Your Conversion Funnel?
- 5. Measuring Attribution For Each Part Of The Funnel
- Conclusion
Without the right team, a deep understanding of the business, and the ability to do analysis, testing and optimization – “data science” isn’t going to take you far.
When I wrote my second book – “Digital Analytics Primer” – I wanted to to introduce people to a perspective on how to learn the concepts and execute value-creating analyses. Both of my books articulated a concept called “The Analytics Value Chain” that explains what it means to “do analytics” and “create value” from it:
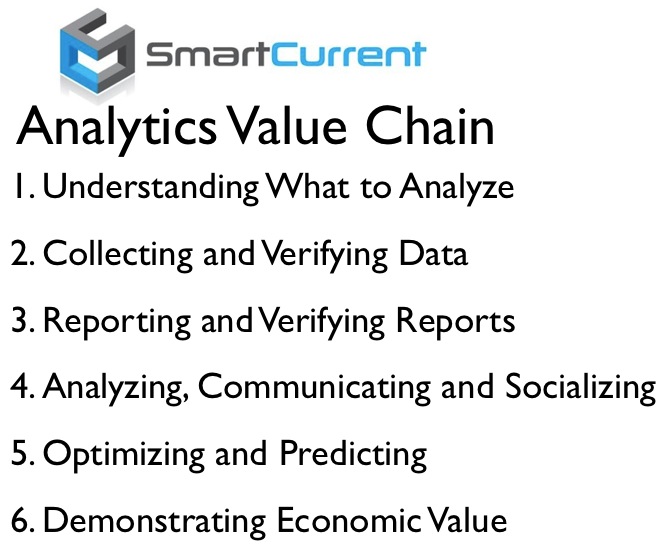
By focusing on The Analytics Value Chain, companies can understand how to control, operate, and maximize benefit from the all of the technical requirements and functions needed to successfully do analytics.
This mindset, or something like it, is necessary to help key players within a business understand how data science & conversion rate optimization play a role to business growth.
15% Of CMO’s Don’t Measure Marketing ROI, 27% Rely On Manager Judgements
Though it may seem obvious, according to the CMO Survey, which collected responses from Fortune 1000, Forbes Top 200, and other high ranking Marketers, found that the state of analytics even now in 2014, is quite dismal.
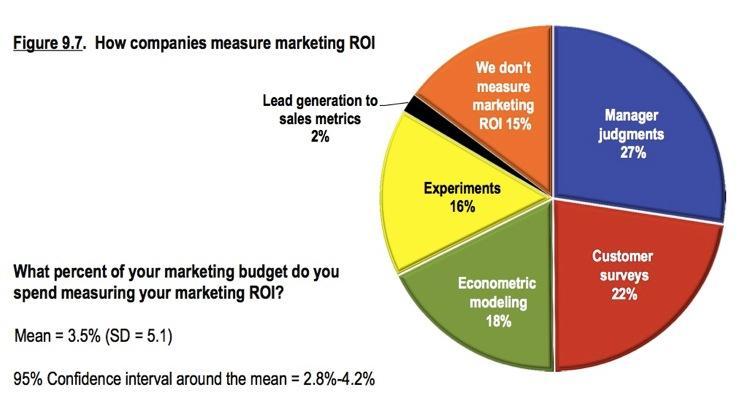
Here are the highlights:
- Only 2% of companies are tracking lead generation to sales metrics.
- 15% of companies don’t track ROI (Return on Investment)
- 1 in 4 companies are depending on “manager judgements” to make decisions.
- 25% of all marketing teams can’t even figure out how to add data into consideration during the decision making process.
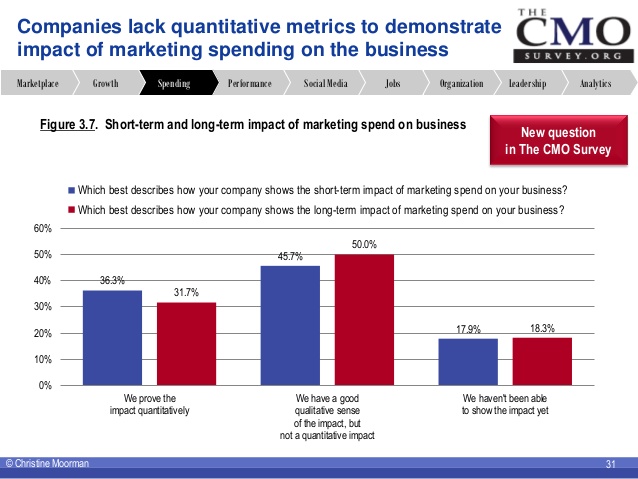
Analytics brings a level of transparency and accountability to business leaders that can be uncomfortable or unexpected because data can show the truth.
If every business were as “data-driven” as they claimed & held actually held accountable to increasing quantifiable metrics – a lot of people would be out of a job.
Why “Data” Is Misunderstood, Ignored, Or Otherwise Not Acted Upon
But I’ve been around long enough to know that data can be incorrectly collected, reported, and analyzed.
People can lose the faith in analytics and analytics teams, which causes decisions to be made from “the gut.” After all, I always say that “unless data supports commonly held beliefs or shows positive performance, it will be questioned and challenged.”
It’s easy for marketers to dismiss data when there’s a perception of inaccuracy.
Several common subjects in analytics are easy to not fully explore or elucidate with data, or to totally get so wrong, the data is just crap.
Couple this with technologies that are incompatible with each other, “Experts” who preach analytics without wide practical experience, analysts who are learning on the job, a lack of data standards or governance & vendors who don’t don’t take the time to understand how you use their tools, and it all becomes a real mess.
As a result, there are 5 common areas within digital analytics that are are not using the correct model & are being measured inaccurately or worse, not at all:
1. Measuring The Journey From Prospect To Lead
Prospects are unqualified leads. These are your “visitors” or “traffic”, and are, for the most part, anonymous.
Leads on the other hand are qualified prospects that have voluntarily given some identifying information that makes them known in some way.
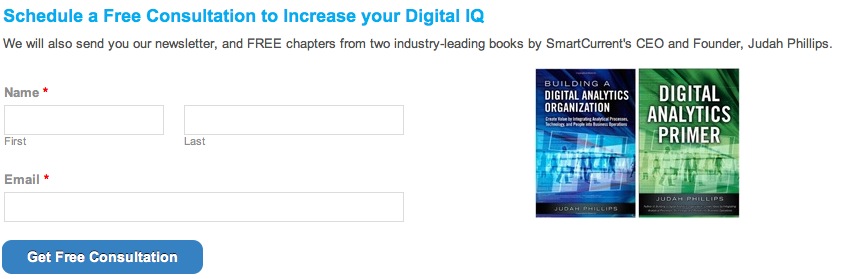
If you’ve ever heard of “lead generation” site, then you get it. People visit your site, fill out a form to request something or join something (like the SmartCurrent newsletter) – and then they are leads.
Once a company has a lead, they may execute a “communication sequence” to compel the lead to buy something or give more information incrementally.
The key in understanding leads with digital analytics often starts by using campaign codes.
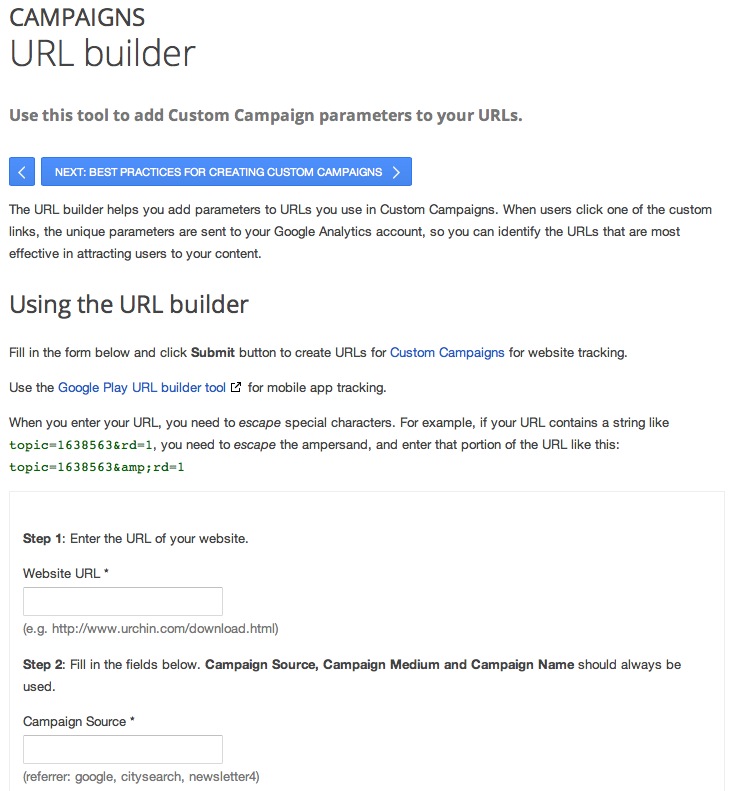
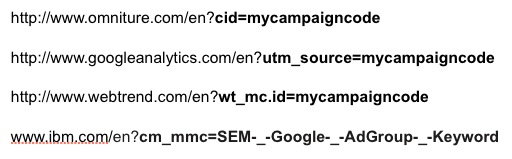
These codes are query-string parameters assigned to particular inbound advertising campaigns in way specific to each analytics tool.
Omniture’s standard campaign coding conventions are different from Google Analytics, which are different from IBM’s and Webtrends.
Most tools can be configured to recognize campaign codes that fall outside of the default markup/format. Campaign codes can also be set outside of the query string in certain tools (cookies, hidden form field, etc).
Related to campaign codes are the metadata you collect via tagging within a digital experience. For instance, you may use javascript tagging to identify traffic that moves across certain sections of a site, or across certain sequences and flows.
So for example, with the proper configuration, you could track the activity of prospects that came from a retargeting campaign and begin to explore deeper areas of the site, reviewing content sections and using certain functions (like internal site search).
You may want to use tagging to capture information (metadata) about those pages and functions that go well beyond the page name. You may want to collect the type of function used on the page (i.e. search), the keyword, the type of content read, the person who authored the content, and so on.
Taken to the next level, you may want to collect specific clicks (i.e. events) that occur before the prospect reaches a lead form.
But in many cases, this type of data is not determined ahead of time nor architected into an analytics solutions. Or if it is, it may not be aligned for answering the business questions the company may have about the lead.
What to do? You need to define a campaign coding naming convention and make sure it is practiced consistently and always. Bruce Clay gives a useful review for Google Analytics on his blog.
You need to determine the types of information about the pages and flows you want to use to better understand the prospect and lead. You want to define the specific events, subordinate to the page view, about the pages and flows that you want to track; implement, test, and analyze them in the context of the lead generation flow.
You want to tag all the elements of your forms and see where people drop off and where they complete the form.
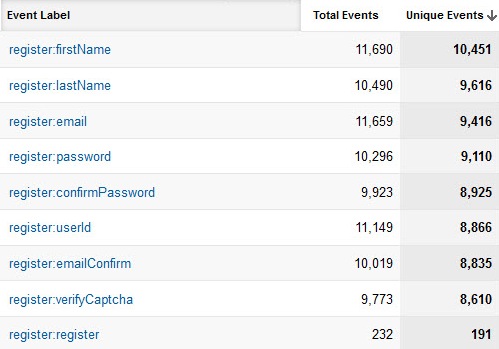
You want to collect the full, relevant set of information that you can segment and pivot against to understand the prospect and lead flow in way that can drive hypothesis testing to improve it.
2. Measuring Actual Customer Activity
For sites that sell something, it’s completely obvious to say that “customers are important” and that “understanding who your customers are and what they think is very important.”
But I once met a CEO who told me “I don’t care what my customers do, as long as they buy.”

In that case, I found an analytics implementation that was largely devoid of real customer data or any useful instrumentation for advanced data collection and segmentation.
Customer data is often in the domain of CRM systems, like SAP or Salesforce.com, or in the absence of Customer Relationship Management platform, the customer database or data warehouse.
For publishers, it may in something called a Data Management Platform (DMP). You may have heard that your analytics tool can’t – for one reason or another – support having Personally Identifiable Information or other customer data.

No, you can’t do certain things with Google Analytics, but the reality of being sophisticated with analytics is that you aren’t likely to be using Google Analytics on customer data; you may have another tool.
In other tools, it’s completely possible to understand the customer in the context of their digital behavior by going beyond the page tag and into BI or perhaps a Digital Data Distribution Platform (D3P) in the cloud.
Adding “custom dimensions” or roundtripping data from your data warehouse, DMP, CRM, and so on can have inordinate levels of applicability for better understanding your customer’s and their behavior.
In my experience, analysts were rather excited when they were able to use DoubleClick’s gender, age, affinity, and interest group information in Google Analytics.
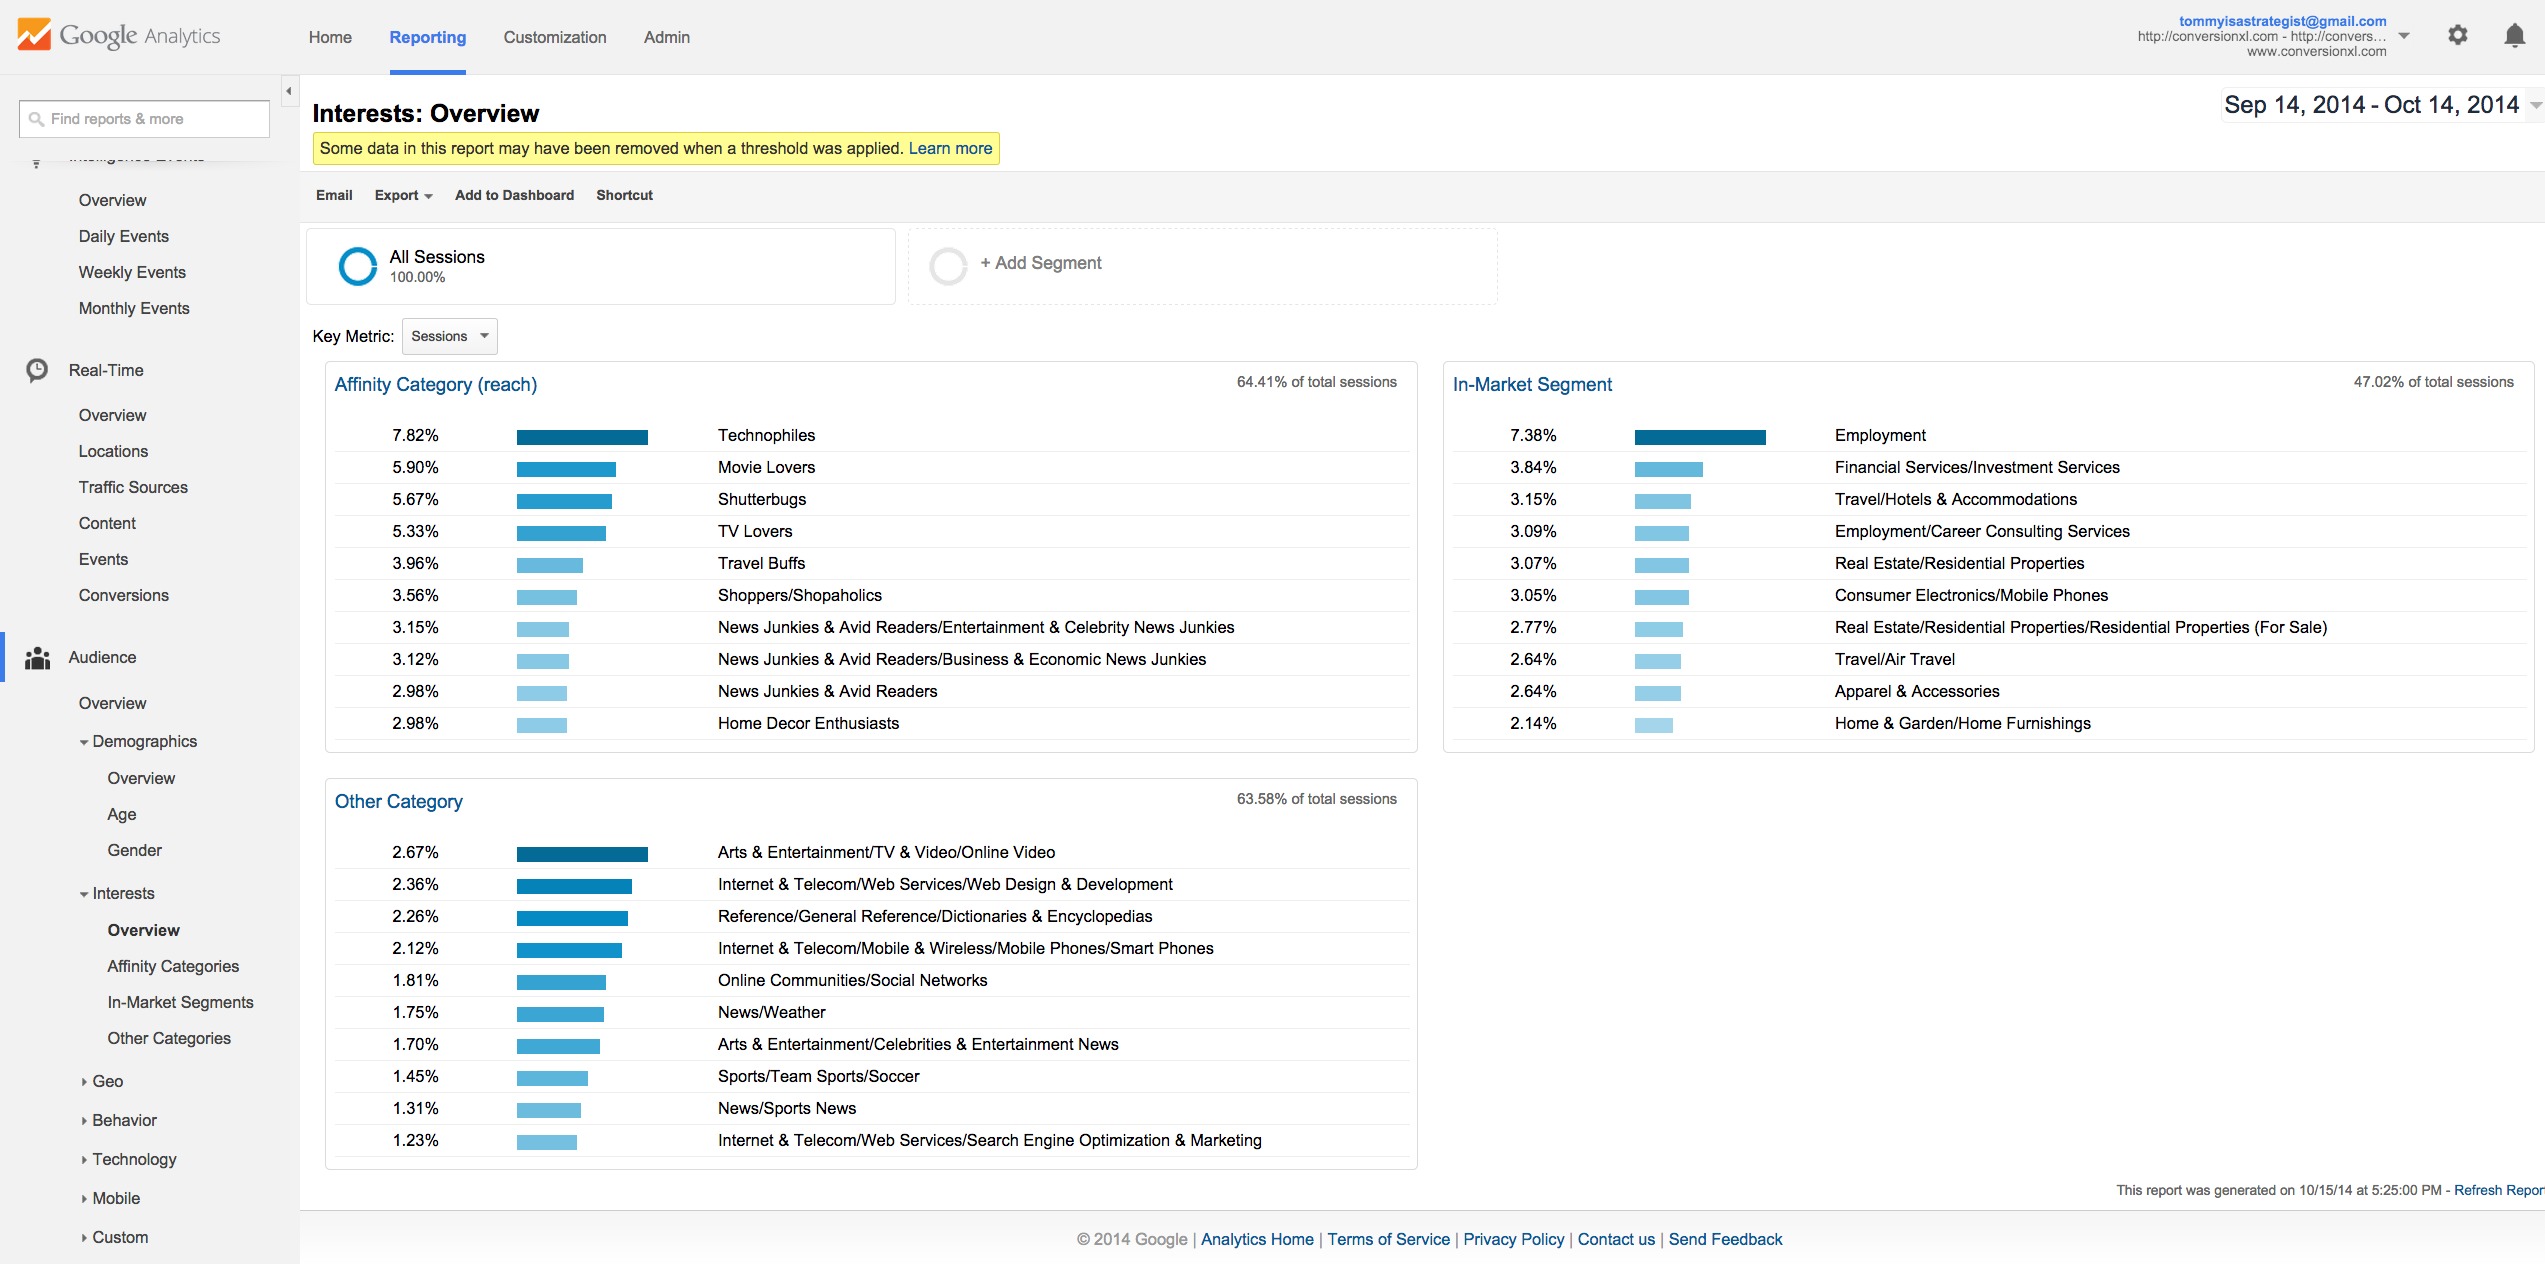
But that type of information, at the detailed level, has been brought into enterprise analytics implementations for years. You just had to spend a lot of money on tools (you may still need to) and have the right team who knew how to do it technically in a way meaningful to the business.
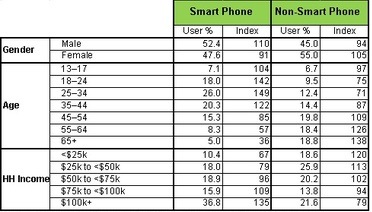
Having attributes of your customer, whether a userid, a DMA/MSA, household income, family size, race, gender, and other purchasing propensities and properties (like Customer Lifetime Value) can be helpful.
What Do You Do To Improve Customer Data In Your Analytics?
First, you find out what the customer schema looks like. Ask your Business Intelligence team or your CRM provider.
- What data is available?
- What business questions do your stakeholders require?
- What data would help your analysis projects?
Then figure out the right definitions for it, the right place where it should live, and the best way to join it together and allow analysts and business users to access it.
3. How Well Is Your Advertising Performing?
Like understanding the sources of traffic using campaign codes, you want to do something similar for advertising.
First, your advertising is either Paid, Owned, or Earned Media. All advertising should be classified into those classifications.
- Display ads are Paid Media
- Your blog is Owned Media
- Socially-shared content posted by others not at the company or being paid by you is Earned Media.
Better understanding your advertising in your analytics starts by simply classifying your paid, owned, and earned media using campaign codes or metadata. For example, the tools CampaignAlyzer and Tracking First can help the process of managing and governing campaign codes.
That’s a level about the simple source/medium in Google Analytics.
Next, you need to classify the types of campaigns into whether they are direct response or for branding purposes and whether the advertising was message-centric or value-centric.
Direct response means you expect people to do something when they arrive at your site. You expect them to take an action.
Whereas branding is a bit softer and meant to promote an increase in the awareness or equity of a brand or product (without the required response).
Many ads, like banner ads, or pre-rolls, interrupt the audience; these are message-centric ads. Other ads, where something is given away for free (perhaps a membership, an incentive, an offer) are value-centric.
This type of message-based vs value-centric designation may sound odd, but Netflix putting a banner ad on an affiliate site (message-centric) is a very different ad from creating high-quality content (like “House of Cards”) and advertising that custom programming via owned and earned channels(value-centric).
Then, of course, there are the simple campaign parameters, such as the type of campaign (banner, CPC, blog, video, and so on) and specificities like the ad group or keyword.
These parameters and the nature of advertising the can be expressed in analytics can be highly-specific to the company. They could even include the device target (mobile vs tablet vs site) or the size and format of the ad.
You may want to bring this data in by integrating with your Ad Server, social network, DMP, or D3P. Regardless, it is important to enhance the data in your analytics to include more information that can help you better understanding the origins and types of advertising to better understand conversion.
What To Do Next About Your Advertising?
Learn more about it. Understand how to classify it.
Determine how to pass the data into your analytics via tagging, your Tag Manager, Business Intelligence technology, or other ways to integrate the data.
4. Where Are The Leaks In Your Conversion Funnel?
The key to extra-large conversion is tracking your conversion funnel.
But the traditional idea of a conversion funnel is half-baked. Your anonymous or mostly anonymous visitors during a single visit go through a discrete series of steps before they transition to point where value is created (i.e. the conversion).
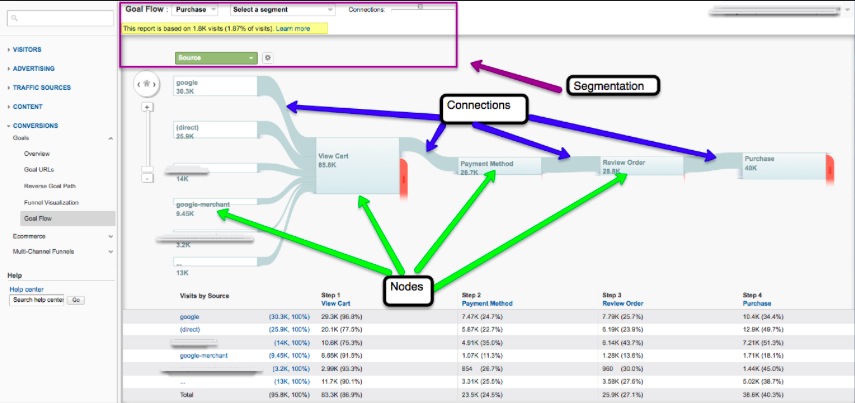
In the eCommerce funnel, a visitor:
- Comes from a campaign (with a campaign code)
- Searches from products
- Browses the product catalog
- Adds one or more items to their cart
- Begins the shopping cart flow
- Submits some personally identifiable information & payment info
- Eventually views a Thank You or Confirmation page
That’s your conversion funnel. But is it really?
Isn’t it a bit daft to think of conversion as a series of linear steps that occur during a single visit?
And even if it is valid, when do you begin measuring it?
Does the funnel begin on the clickthrough to the site? After the product has been added to the cart? When the Shopping Cart flow starts as a guest or logged-in member?
Sure, it depends on the business questions, requirements, and definitions of a conversion, but what is the right way to measure conversion?
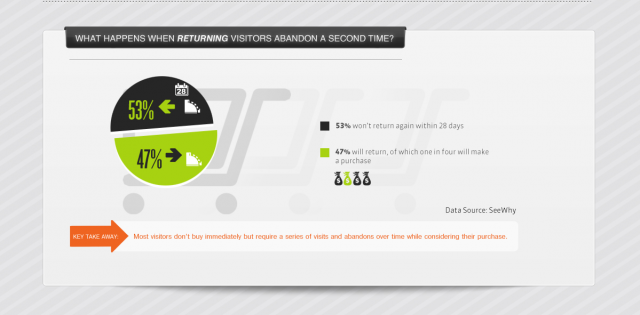
Is it the Kaushikian “minor conversions” and “macro conversions” that should be instrumented with event and goal layers? Is there a scenario from session start to the purchase that should be tracked? What about shopping cart abandonment and reentering the funnel at a later date to complete the purchase?
The answer will vary from business to business, but understand it’s these nuances that can make or break the usefulness of conversion tracking and your conversion funnel.
Taken to the next level, is the “funnel” even an accurate metaphor for expressing user behavior?
Sure the “funnel” is a clever marketing term that makes it easy to understand. But it is true that a wider funnel isn’t just making the steps in your conversion more persuasive, it actually means considering what happens in the different layers/modals, events, and in the pre and post-behavior before and after the purchase, when the purchase is abandoned, and even when completed with latency during a different visit.
What Do You Do About Your Conversion?
First, you need to define what a “conversion” actually is, socialize the definition of the steps to conversion within your organization, and ensure your data collection is appropriately instrumented to collect the specific steps you define.
That will mean tagging for goals and events – and it will mean figuring out how to determine when someone comes back and purchases later and when revenue is captured after abandonment.
In fact, it’s probably more apt to reconsider “the funnel” entirely. I sometimes call it “The Tumbler” where a visitor is Seeking, then Shopping, then Sharing.
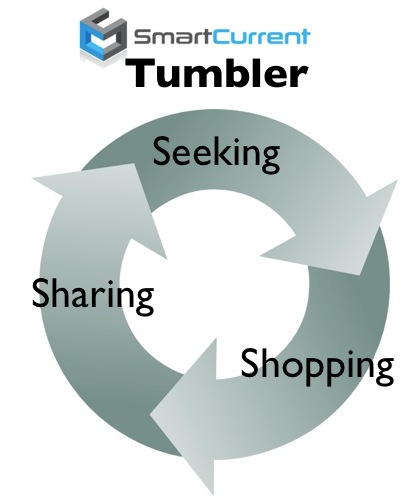
Seeking
These are part of the off-site activities that lead people to your site. For example, the keyword search, the advertising campaign, the social media referral…
Aren’t these part of your conversion story?
Shopping
The traditional funnel you may already be measuring in all its rich glory and event-level and goal-level interactivity.
Sharing
What happens after the purchase, which is not necessarily part of the purchase, but in terms of customer satisfaction, likelihood to recommend, and other measures of brand health can have significant impact on your conversion rates.
Understanding the data behind how the existing share to conversion ratio can help you to decide whether moving into arenas like referral marketing will be right for your business, and give you a better data-informed predictions on what the success of such a program might be.

Consider the “tumble” through the journey on the path to purchase – what happens before and after the shopping & how they arrived at your site in the first place.
5. Measuring Attribution For Each Part Of The Funnel
Attribution is a fancy term for identifying what caused the conversion.
It can be a complicated type of analysis. You can spend many months preparing data, hundreds of thousands of dollars on vendor software, and significant cerebral power and data science trying to attribute what caused people to buy.
Or you can tag and group your campaigns in certain tools, like Google Analytics, and get a free way to understand conversion.
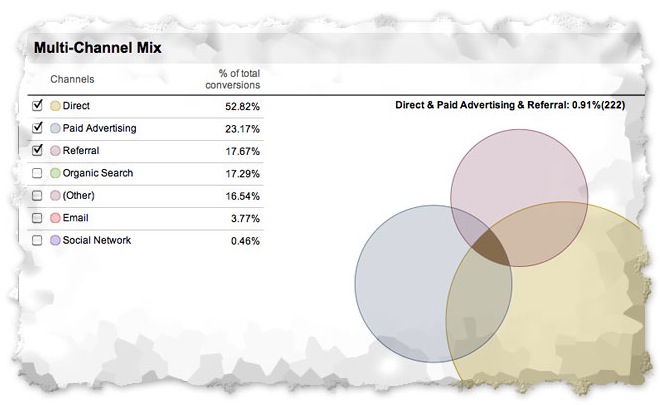
You’ve heard of “Last Click or Last Interaction” and “First Click or First Interaction” and maybe even explored the nuances of “Last Ads” or “Last Non-Direct” attribution.
Recommended Reading on Attribution:
- What Is Marketing Attribution?
- Digital Attribution Comes Of Age Report
- Multi-Channel Attribution Modeling: The Good, Bad and Ugly Models
- Why You Should Care About Marketing Attribution
Perhaps you’ve considered “Equal” attribution where all touches are given equal credit in assisting the conversion. Or you’ve thought about “Time Decay” where all customer touches that occurred nearest to the conversion are given an increasing credit as an assist to conversion.
Or maybe you haven’t and are still wondering why your Ads (First Interaction) is different than your Paid Search attribution in Google Analytics (Last Interaction).
Adding to the challenge of attribution are the actual financial measures behind the conversion. That is the cost and revenue data that enable you to look at things like ROAS (return on advertising spend) vs ROI (which can include margin).
What Do You Do About Conversion?
First, like all things with analytics, you need to consider your business goals, purchase cycles, the duration before a conversion, and the types of campaigns you are running.
Then you need to take a look at the different attribution models to identify what they calculating and telling you about the performance of your campaign mix.
In short, you can’t just assume credit for a source from looking at one model or not thinking deeply about attribution and how to best express credit for your conversion without just accepting the default view.
You need to consider the impact of cost, revenue, and margin on your attribution modeling.
Conclusion
So there you have it 5 areas where you may be measuring perfectly or you may be measuring incorrectly.
It’s hard to say what’s right or what’s wrong without considering your analytics as part of The Analytics Value Chain.
The value chain where you are aligning your business goals and requirements, data collection, data governance and definitions with your reporting, analysis, optimizations, predictions, and automations in order to best understand your prospects, leads, customers, conversions, and attribution.
Related Posts
-

In digital analytics, it’s all about asking the right questions. Sure, in the right context,…
-
A/B testing tools like Optimizely or VWO make testing easy, and that's about it. They're…
-
The success of an online business is measured by various indicators. The data required comes…
-
According to Amplitude, product analytics "show you who your users are, what they want, and…

Excellent post, Judah. I particularly enjoyed your discussion in point #2. While it is true that more and more customer data can be pumped back into 3rd party analytics tools (including GA), you make a good argument that traditional BI tools “data warehouse, DMP, CRM, and so on” are still the place where the real insights will be found.
Judah,
Awesome post man, very informative and to full of good details. It’s very important to know how to track your results correctly if not you can wasting your time, energy and efforts doing things that aren’t necessary. One thing I know for sure, if you aren’t tracking your results, than you are basically walking around with a blind fold.
Regards,
Matthew J Trujillo
Very nicely written post, Judah … thanks for your contribution to the digital marketing knowledge sphere! I’ve always been data-driven, but I’ve become even more data driven recently. There is data for everything, right. Love the reference to Avinash Kaushik’s macro and micro conversion article … both macro and micro conversions are very important to online business sustainability and profitability.
Really impressive post Judah! I learned a lot. You really know your analytics & marketing. Thanks a lot for posting.