Conversion research is a systematic search for new and useful information about user or customer behavior. It uses quantitative and qualitative methodologies to build hypotheses that can be tested within an applied framework, such as A/B testing.
So how do we go about gathering and analyzing data?
The thing is that we don’t just need more data, we need better data. Data that we can act on. For every piece of data that you gather, you need to know exactly how you’re going to use it. Forget “nice to have” data. “Must have” only.
So we need to be smart about it. Data is only useful if it can lead to insights. Insight is something we can turn into a test hypothesis. If we have too much data, it causes analysis paralysis – too overwhelmed by the sheer volume of data – so we won’t do anything.
Over the years of doing this, I developed a conversion research framework that I use – and it works really, really well. I call it ResearchXL.
ResearchXL™ framework
You can use this framework for each and every optimization project. It’s industry-agnostic – doesn’t matter if the site you’re working on is a B2B lead gen, SaaS, ecommerce or non-profit site. The process you use to get higher conversions is exactly the same across all websites.
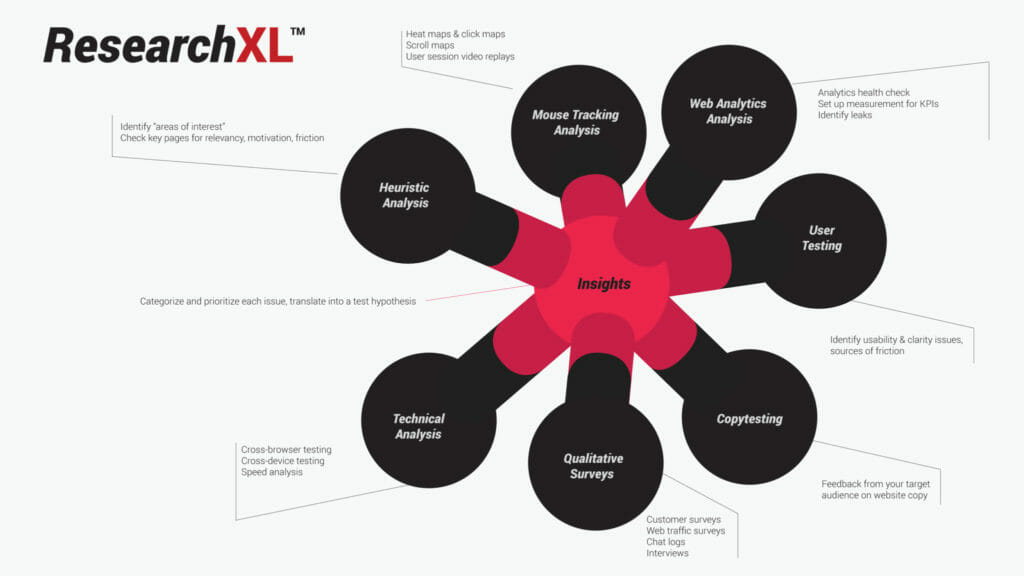
There are 6 steps of data gathering and analysis, followed by creating a master sheet of all found issues that we then turn into action items.
It might sound scarier than it is. Over the next days and weeks we’ll look at each step individually. This lesson focuses on the big picture + first 2 steps.
Use the framework as your tool, your guide, your process map.
It looks like this:
Step 1. Technical analysis
- Cross-browser testing
- Cross-device testing
- Conversion rate per device / browser
- Speed analysis
Step 2. Heuristic analysis
- Identify “areas of interest”
- Check key pages for relevancy, motivation, friction issues
Step 3. Web analytics analysis
- Analytics health check: is everything being measured, is everything accurate
- Set up measurement for KPIs
- Identify leaks
Step 4. Mouse tracking analysis
- Heat maps & click maps
- Scroll maps
- User session video replays
Step 5. Qualitative research / surveys
- Customer surveys
- Web traffic surveys
- Chat logs
- Interviews
Step 6. User testing
- Identify usability & clarity issues, sources of friction
Step 7. Copy testing
Copy is the biggest driver of conversions in most cases.
The problem with improving your copy is that you don’t have data on what needs work. What parts of the copy help you increase the conversion rate, what hurts your sales – and why?
Copy testing is about putting your copy in front of your audience, and learning how they perceive it.
Conducting copy testing will help you answer:
• What does your headline make them feel?
• Do they care about the arguments you’re making?
• Which benefits are they most interested in?
• Do they even understand the copy in the third paragraph?
• After reading everything, what remains unclear?
You can do this via qualitative research interviews (recruit 15-20 people from your audience, formulate research questions about your copy, then conduct interviews, compensate panelists), or by using Copytesting.
Step 8. Sum-up
Categorize and prioritize each issue, translate into a test hypothesis
Explaining the framework
Let’s now dive into each specific element of the framework. In this lesson we’ll cover the first two steps.
Step 1: Technical analysis
Don’t even think about anything else until we’ve fixed all the technical stuff. Bugs are your main conversion killer.
You think your site works perfectly – both in terms of user experience and functionality – with every browser and device? Probably not.
This is a low-hanging fruit, one that you can make a lot of money on (think 12 month perspective). Open up your site in non-mainstream browser (e.g. IE9) and some non-mainstream device (e.g. Nexus tablet) and conduct a walkthrough of your site. Find any annoyances? Fix them.
You don’t need to own all the devices and you don’t need all browsers installed on your machine. Use services like https://crossbrowsertesting.com/and http://www.browserstack.com/.
Open up your Google Analytics and go to Audience -> Technology -> Browser & OS report.
You will see the conversion rate (for the goal of your choice) per browser. Note: You must look at the one device category at a time – so apply a device segments first: desktop only, tablet only and mobile only. You can’t pile all device categories into one, or you will be fooled by averages.
You need to drill down to a specific browser version (e.g. IE8, IE9 etc) – and see if a particular browser converts less than others. So if IE10 and IE9 convert at 5%, but IE8 converts at 2%, you have a reason to believe that there are some cross-browser issues there. Now fire up IE8 and go figure out what’s up.
“But no one uses IE8 (or whatever lesser used browser)!”
That’s an opinion. If you find a low-performing browser that’s not used very much, do this:
- Look up the number of IE8 visitors per month.
- Look up the average transaction amount. Let’s assume it’s $50 for this example.
- Calculate: if IE8 (currently converting at 2%) would convert the same as IE10 (currently 5%), how many more transactions would we have over 6 month period? Let’s pretend that we’d get 200 transactions more over 6 months.
- Multiply that number with avg transaction amount ($50), so 200×50=$10,000
- How much time will it take to identify and fix the bug? 3 hours? Is 3 hours of developer time more or less than $10k? If less, fix the damn bugs!
Repeat this flow with each browser that’s converting sub-optimally.
Making money already!
If you’re thinking: “this does not sound like conversion optimization!”, you’re wrong. Remember: our job is to optimize our website so our business would grow. Plugging cross-browser & cross-device leaks equals growth.
Next up: speed analysis.
The goal: figure out overall website speed, and analyze load speed per page.
Key thing to know – there’s a difference between “page load time” and “page interactive time”. The first one means “seconds until every element on the page has done loading” and second one means “seconds until the site is usable”. The latter is much more important, it’s the key metric you want to pay attention to.
If the site loads within 3 seconds, you’re doing fine. Up to 7 seconds? Quite typical, can be improved. More than 10 seconds? Gotta do something!
Where to look for site speed data:
- Google Analytics: Behavior → Site Speed → Page Timings. You want to look at page load time and page interactive time per page – starting with the ones that have the most traffic (== affect the largest number of users). Mark down all URLs that load with sub-optimal speed.
- Use Google PageSpeed Insights (can also be accessed from within GA). Enter every URL you wrote down, and it will list all the found issues. Forward those to your front-end developer – and ask to fix every single one of them.
- Use Pingdom or similar to see the number of requests, and how long each one takes. This helps you identify slow-loading scripts, especially those loaded from external domains. Keeping the number of scripts the page loads (called “requests”) down is essential for better load times.
- Always use caching, compression and minification (if the website runs on Apache web server, have your server guys install PageSpeed module).
Read this article I wrote on the key speed optimizations you want to do on most sites:
https://cxl.com/blog/11-low-hanging-fruits-for-increasing-website-speed-and-conversions/
Step 2: Heuristic analysis
This is as close as we get to using opinions to optimize. But – it’s way more productive than just randomly sharing stupid ideas.
Let’s start with a definition: heuristic analysis is an experience-based assessment where the outcome is not guaranteed to be optimal, but might be good enough. It’s main advantage – speed. It can be done fairly quickly.
In essence this is us – optimizers – reviewing a website, page by page, based on our experience of what we’ve seen work before, “best practices” and stuff like that. BUT – we do it in a very organized, structured manner.
AND – most importantly – whatever we identify or discover through heuristic analysis is not the truth (since it’s still kind of an educated opinion). The outcome of it is what I call “areas of interest”. And in our next phases of conversion research – qualitative and quantitative research – we seek to validate or invalidate the findings.
What does the structured website review look like? We assess each page for a certain set of criteria:
- Relevancy: does the page meet user expectation – both in terms of content and design? How can it match what they want even more?
- Clarity: Is the content / offer on this page as clear as possible? How can we make it clearer, simpler?
- Value: is it communicating value to the user? Can we do better? Can we increase user motivation?
- Friction: what on this page is causing doubts, hesitations and uncertainties? What makes the process difficult? How can we simplify? We can’t reduce friction entirely, we can only minimize it.
- Distraction: what’s on the page that is not helping the user take action? Is anything unnecessarily drawing attention? If it’s not motivation, it’s friction – and thus it might be a good idea to get rid of it.
Read more: https://cxl.com/blog/how-to-increase-sales-online-the-checklist/
So during the process of heuristic analysis you have to avoid random comments, and strictly stick to assessing the page for named criteria – writing down your “findings”.
Heuristic analysis works best when done in a group – include fellow optimizers, designers, usability people, copywriters, and janitors. Just remember to explain the rules to everyone at the start.
I personally find it most effective to annotate findings on screenshots – so it’s clear what we mean. There is no right way of doing it. You can use Jing to capture screenshots and add comments on top of it, you can use PowerPoint or a collaborative annotation tool like Zipboard, Pageproofer or Usersnap (you can write comments on the same screenshots at the same time while using your respective computers). The tool does not matter.
Example, executed in Google Docs Presentations:
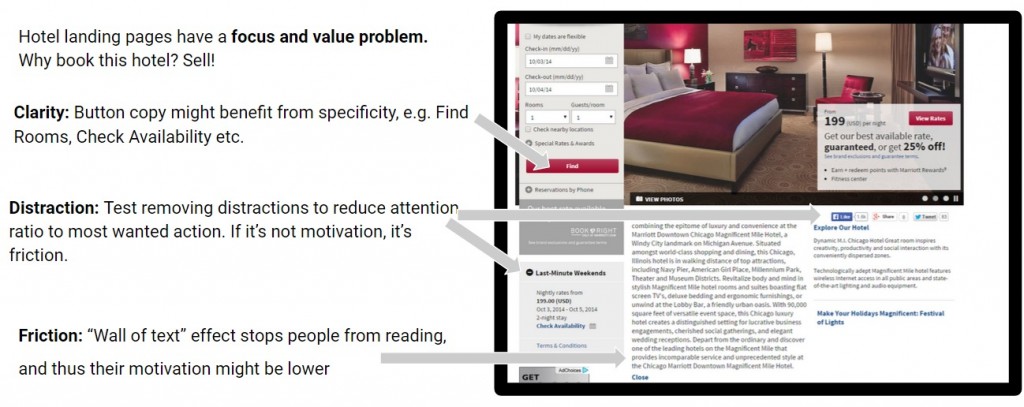
And remember – whatever you write down is merely an “area of interest”.
When you start digging in the analytics data and putting together user testing plans and what not, make sure you investigate that stuff – with the intention to validate or invalidate whatever you found.
Read Next Lesson or Download guide as PDF
-
#1: Mindset of an Optimizer
You seek to understand your customers better - their needs, sources of hesitation, conversations going on inside their minds. -
#2: Conversion Research
Would you rather have a doctor operate on you based on an opinion, or careful examination and tests? Exactly. That's why we need to conduct proper conversion research. -
#3: Google Analytics for Conversion Optimization
Where are the problems? What are the problems? How big are those problems? We can find answers in Google Analytics. -
#4: Mouse Tracking and Heat Maps
We can record what people do with their mouse / trackpad, and can quantify that information. Some of that data is insightful. -
#5: Learning From Customers (Qualitative Surveys)
When quantitative stuff tells you what, where and how much, then qualitative tells you 'why'. It often offers much more insight than anything else for coming up with winning test hypotheses. -
#6: Using Qualitative On-Site Surveys
What's keeping people from taking action on your website? We can figure it out. -
#7: User Testing
Your website is complicated and the copy doesn't make any sense to your customers. That's what user testing can tell you - along with specifics. -
#8: From Data to Test Hypotheses
The success of your testing program depends on testing the right stuff. Here's how. -
#9: Getting A/B Testing Right
Most A/B test run are meaningless - since people don't know how to run tests. You need to understand some basic math and statistical concepts. And you DON'T stop a test once it reaches significance. -
#10: Learning from Test Results
So B was better than A. Now what? Or maybe the test ended in "no difference". But what about the insights hidden in segments? There's a ton of stuff to learn from test outcomes. -
Conclusion
Conversion optimization is not a list of tactics. Either you have a process, or you don't know what you're doing.