Google Analytics is a HUGE topic. Before even thinking about specific tactics and what not, it’s important to understand the big picture of how to use analytics in conversion optimization. This is what this lesson is about.
When doing optimization work, Google Analytics is your best friend. If you’re not very skilled at it – most marketers aren’t – you’re missing out. You need to take the time to learn. Your career depends on it.
Gone are the days when a brilliant idea – a result of a brainstorm in the marketing department – was enough. Now you need to know the specific impact of every idea.
You have a strategy? Great, measure it. You added a new feature to your website. Well – how many are using it? Are people using it more likely or less likely to convert?
If your Google Analytics skills max out at checking how much traffic you’re getting, which country they’re coming from and how many minutes on average they spend on your site, you know nothing. This is useless for CRO purposes.
Note for analytics newbies: Google itself has released a pretty good introductory course called Digital Analytics Fundamentals – I suggest you take it.
What can we learn from Google Analytics?
This topic would take a three-day workshop, but for this essentials course I will point out the key stuff.
Always approach analytics with a problem: you need to know in advance what you want to know, and what are you going to change / do based on the answer. If nothing, then you don’t need it.
In a nutshell, we can learn:
- what people are doing,
- the impact and performance of every feature, widget, page,
- where the site is leaking money,
… but we won’t know why. Heuristic analysis and qualitative research are your best attempts at figuring out the ‘why’. Analytics is more like ‘what’, ‘where’ and ‘how much’.
Follow the data!, they say. Well, truth be told, data won’t tell you anything. It is up to you to pull the insights out of the data. And this requires practice. As with everything – the more time you spend at looking at data, and trying to make sense of it, the better you’ll get at it.
It’s time well spent, no matter what. If I were a (full-stack) marketer today, and not analytics-savvy, I’d fear for my future. You need to love analytics. Remember, love at first sight rarely happens. Spend more time together.
Averages lie – look at segments, distributions, comparisons
Most companies market to their average user, most marketers look at average numbers in analytics. But that’s wrong.
So if your buyer #1 is a 12 year girl from Finland, and buyer #2 is a 77 year old dude from Spain, the average is sexually confused 30-something in Austria. That’s the market you think you’re after. See what I mean?
Your “average” conversion rate is 4.2%. But it becomes much more interesting if you look at it per device category segment – desktop, tablet, mobile. You now have a much better picture.
Instead of looking at a static number, look at distributions.
Distributions will also insightful in the case of “totals”. So instead of just looking at total transactions:
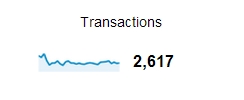
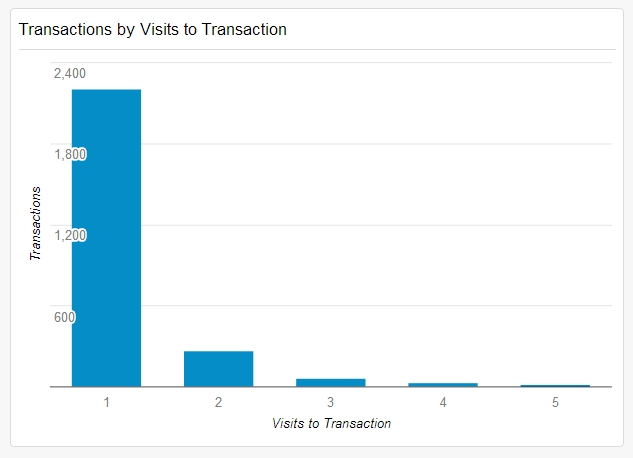
You could look at the number when it’s distributed by “visits to transaction”, and learn that most people are ready to buy during their first visit:
And always, always use absolute numbers next to ratios. For instance, if landing page A results in 8% conversion rate and landing page B has 2% conversion rate, you need to know the absolute number of conversions to know if you can trust the ratio.
If the total number of actions is less than 100, be very suspicious of it – the ratio is probably wrong (sample size not big enough).
Measuring the important stuff
I see a lot of Google Analytics setups. Hundreds and hundreds. Most companies struggle with the proper setup. Most companies are not measuring everything that matters.
You need to measure all the important stuff. Every action people can take on your site. Especially your KPIs.
A key performance indicator (KPI) is a metric that helps you understand how you are doing against your objectives. A metric is a number.
So your KPIs might be ‘conversion rate for email captures’, ‘revenue per visitor’, ‘number of downloads per month’.
There are useful metrics, and useless metrics. The job of a metric is to provide actionable insight. You need to be able to look at a metric, ask “so what”? – and have an answer.
Let’s say you run an ecommerce site. Your ‘time on site’ is 3:42, 15 seconds less than it was last month. So what? Umm… well nothing I guess. So stop paying attention to it! Focus on metrics that do matter.
In most cases ‘time on site’ is quite a useless metric for an ecommerce site. Whether people spend more time or less time on a site does not correlate with the amount of money you’re making. You should NOT optimize for ‘people spending more time on the site’. Focus on ‘revenue per visitor’ instead.
So – make a list of all possible desired actions a user can take, such as:
- click on ‘add to cart’,
- change sort order from ‘featured’ to ‘best-selling’,
- interact with widget X,
- narrow down product selection via price filters,
- use site search,
- use comparison tool,
- join email list,
- buy stuff,
- and so on.
- Now make a list of the bad stuff that can happen:
- enter incorrect login,
- see error messages when filling out billing info,
- error 404 – page not found,
- remove product from cart,
etc.
Next – set up measurement for all of these items. Some of the stuff you might be able to measure by setting thank you page URL as a Goal, for most of this stuff you will need event tracking.
Here’s an example. An ecommerce site has a feature. I set up a segment for people that use this feature. Now I’m comparing site average ecommerce performance to this specific segment:
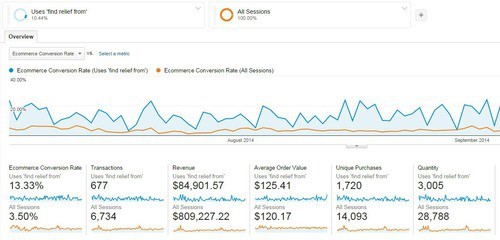
What do we see? People who use this specific feature convert almost 4x better, and spend slightly more money. That’s an insight!
There could be lots of reasons for this – we don’t know for sure just by looking at these numbers. But right now ~10% of users use this feature. What would happen if we got 20% to use it? This insight can be turned into a test hypothesis.
If we didn’t measure this stuff, we would have no idea. No data-driven hypothesis.
If you sell stuff for money on your site, you have a shopping cart system, products at different price points, then you absolutely need to have ecommerce tracking configured on your site. You need a developer for this. If you don’t have it, you’re completely blind when you don’t have to be.
If you have NO GOALS set up – you’re a voluntary idiot. Your analytics are 100% useless. Might as well give up now. Or – get your act together, and start measuring stuff.
You need to have goals set up for all key actions (purchase, lead generation etc). Don’t set goals for stupid shit like “visits about page” – analytics measures visits to pages anyway.
And – you absolutely need to have funnels set up (unless everything happens on a single page): Product page -> Cart Page -> Checkout step 1 -> Step 2 -> Step 3 -> Thank you.
I suggest you read this article very carefully as it has step-by-step instructions for setting up your Google Analytics config.
For setting up event tracking you need one of these three options:
- Use Google Tag Manager to set up event tracking (the best option), naturally requires that you have GTM already set up. Read this article to learn more about tag managers, and read this post on using Google Tag Manager. If you don’t run your analytics through a tag manager, you’re being silly and unnecessarily complicating things.
- Learn to code, so you can manually add event tracking scripts to your site, wherever needed (but don’t do it, use GTM)
- Tell your developer to set up event tracking for everything on your list.
Ideally you only pursue option #1 – it’s the fastest and most sustainable option. Having to go through a developer every time – and hard code each event tracking script – is a pain in the butt, and will likely cause problems down the line.
If you work with a Google Analytics setup that was done by someone else, you need to start with an analytics health check.
In a nutshell: health check is a series of analytics and instrumentation checks that answers the following questions:
- “Does it collect what we need?”
- “Can we trust this data?”
- “Where are the holes?”
- “Is there anything that can be fixed?”
- “Is anything broken?”
- “What reports should be avoided?”
The truth is that nearly all analytics configurations are broken. Take this very seriously. See if everything that needs to be measured is measured, multiple views set up, funnel and goal data accurate (calculate funnel performance manually via Behavior -> Site Content reports, and compare to funnel data as well as your back-end sales reporting tool).
If you see bounce rates under 10%, you can be sure that this is due to broken setup – either GA code loaded twice, or some event triggered right away that’s not set to non-interactive.
I know I’m not being 1-2-3 here, but this is merely an essentials course – and you wouldn’t want this to be 10,000 words long. It’s important to know that this is an issue, and you can do your own investigation from here.
Finding the leaks
Okay – time to find out where you are losing your money. Where’s the flow stuck?
We need to identify specific pages (e.g. Free & Clear Shampoo 12-oz bottle) as well as specific steps (e.g. Product pages) where we are losing money.
Maybe category pages are the problem – not enough people won’t click through to product pages. Or perhaps they get to product pages, but only 1% adds anything to the cart. Or maybe some product pages work really well, but some suck (which ones?). Or maybe plenty add products to the cart, and make it almost all the way to the end – but drop out as soon as credit card is required.
Where are the biggest leaks? Where should we start optimizing? (In most cases it’s not your home page).
This is your checklist to find out:
- Check the funnel performance
- Check conversions per browser version
- Check conversions and bounce rate per device
- Identify high traffic & high bounce / high exit rate pages
- High traffic / High bounce / Low conversion Landing Pages
- Which screen resolution boosts bounce rates?
- High traffic / Low speed Pages
- Check user flows
- Look at conversions per traffic source
- Analyze new vs returning
I’ve written about this checklist at length here.
Before we wrap up, there are 4 more articles I urge you to check out on Google Analytics:
- Google Analytics 101: How To Configure Google Analytics To Get Actionable Data
- Google Analytics 102: How To Set Up Goals, Segments & Events in Google Analytics
- 10 Optimization Experts Share Their Favorite Google Analytics Reports
- 7+ Under-Utilized Google Analytics Reports for Conversion Insights
Read Next Lesson or Download guide as PDF
-
#1: Mindset of an Optimizer
You seek to understand your customers better - their needs, sources of hesitation, conversations going on inside their minds. -
#2: Conversion Research
Would you rather have a doctor operate on you based on an opinion, or careful examination and tests? Exactly. That's why we need to conduct proper conversion research. -
#3: Google Analytics for Conversion Optimization
Where are the problems? What are the problems? How big are those problems? We can find answers in Google Analytics. -
#4: Mouse Tracking and Heat Maps
We can record what people do with their mouse / trackpad, and can quantify that information. Some of that data is insightful. -
#5: Learning From Customers (Qualitative Surveys)
When quantitative stuff tells you what, where and how much, then qualitative tells you 'why'. It often offers much more insight than anything else for coming up with winning test hypotheses. -
#6: Using Qualitative On-Site Surveys
What's keeping people from taking action on your website? We can figure it out. -
#7: User Testing
Your website is complicated and the copy doesn't make any sense to your customers. That's what user testing can tell you - along with specifics. -
#8: From Data to Test Hypotheses
The success of your testing program depends on testing the right stuff. Here's how. -
#9: Getting A/B Testing Right
Most A/B test run are meaningless - since people don't know how to run tests. You need to understand some basic math and statistical concepts. And you DON'T stop a test once it reaches significance. -
#10: Learning from Test Results
So B was better than A. Now what? Or maybe the test ended in "no difference". But what about the insights hidden in segments? There's a ton of stuff to learn from test outcomes. -
Conclusion
Conversion optimization is not a list of tactics. Either you have a process, or you don't know what you're doing.