
The traditional (and most used) approach to analyzing A/B tests is to use a so-called t-test, which is a method used in frequentist statistics.
While this method is scientifically valid, it has a major drawback: if you only implement significant results, you will leave a lot of money on the table.
In this blogpost, I will argue why a post-hoc Bayesian test evaluation is a better evaluation method than a frequentist one for growing your business. If it sounds complicated, don’t worry – by the end of the post, you’ll easily be able to do your own Bayesian analyses.
Table of contents
The Challenges of a Successful A/B Testing Program
The sad truth is that we see a lot of testing programs die a quiet death.
There is a real challenge in keeping such programs alive. If not everyone in your organization believes in experimentation, you will have a hard time proving its worth.

This belief in experimentation is highly dependent upon the number of winning tests. If your win ratio is very low (say, lower than 20%, which isn’t far from the industry average depending who you ask), your website isn’t changing much over time. This will drain the energy right out of your testing team.
Team members have put a lot of time and energy in finding the insights, developing test variations and analyzing them. If these efforts aren’t rewarded, then their energy and motivation will drop (not to mention that the energy from any stakeholders tends to fade quick without ROI).
And another more important consequence is that you will have lower visibility in the organization.

If you only deliver a winning variation once in a blue moon you will not be perceived as very important to the business. Consequently, your program will be deprioritized or even discontinued.
We Need More Winners!
The solution to this problem is to get more winners out of your A/B tests.

But that’s more easily said than done!
You may be able to accomplish this by improving your conversion research or testing bolder changes, but another approach would be to redefine what you perceive as a winner by changing the statistics.
Ok, that may sound a bit sketchy. But there are a couple of challenges with frequentist statistics, which we have been using to evaluate our A/B tests.
Say What? I Don’t Understand!
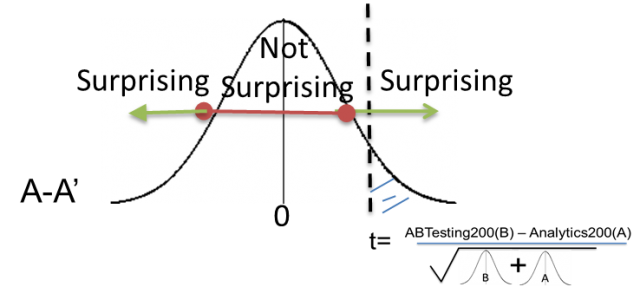
The foremost problem with using frequentist statistics is the difficulty of interpreting the test outcome correctly. A t-test (which is used in frequentist statistics) checks whether the averages of two independent groups differ significantly from each other. The basic assumption of this test is that there is no difference in conversion rate between group A and B. This is the so-called null hypothesis.
With a frequentist test evaluation you try to reject this hypothesis, because you want to prove that your test variation (B) outperforms the original (A). With a set significance level in advance of the test (usually 90% or 95%) you judge whether the p-value (1 – significance level) of the test is lower than the threshold p-value. If the result is very unlikely under the null hypothesis – say with a p-value of 0.02 – then you could safely state that the conversion rate of A is different from that of B.
Innocent Until Proven Guilty
You could compare using frequentist statistics to the process of a US trial.

The null hypothesis in a trial states that the defendant is innocent. This is the starting point of the trial: a defendant is innocent until they are proven guilty without reasonable doubt. The alternative hypothesis thus states that the defendant is guilty. The prosecutor has the burden of proving that the defendant isn’t innocent at all, by presenting incriminating evidence.
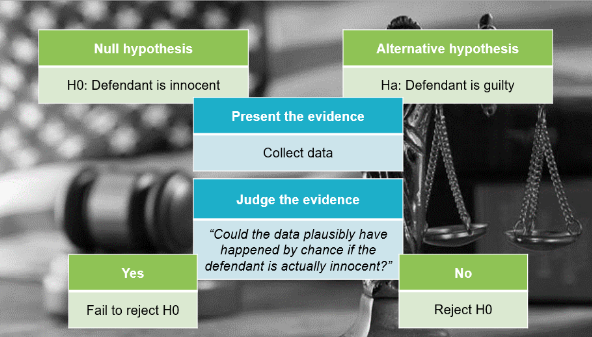
Then, this evidence is judged. The jury asks themselves the question, “could the data plausibly have happened by change if the defendant is actually innocent? In other words, could the null hypothesis still be true?
If the data were likely to have occurred under the assumption that the null hypothesis were true, then we would fail to reject the null hypothesis, and state that the evidence is not sufficient to suggest that the defendant is guilty.
If the data were very likely to have occurred, then the evidence raises more than reasonable doubt about the null hypothesis, and hence we reject the null hypothesis.
In conclusion, a t-test only tells you how surprising the results are based on the hypothesis that A and B perform exactly the same. I don’t know about you, but this confuses the hell out of me! Apparently, I’m not the only one: a recent study showed that over 80% of people totally misinterpret frequentist statistics.
And besides the confusion, I’m actually not interested in “how unlikely it is that I found these results.”
I just want to know whether variation B is better than A. Using frequentist statistics to evaluate A/B tests simply doesn’t reflect the underlying business question.
Winner or No Winner? That’s the Question
The other challenge with using frequentist statistics is that you face a binary outcome: you either have a winner or you don’t. In other words, you can either reject the null hypothesis or fail to reject it. And there is no room for discussion.
If you take a look at this test result below you would conclude that there is no winner and that it mustn’t be implemented. The p-value isn’t low enough to reject the null hypothesis that the variations have the same conversion rate. What we see happening with a lot of clients though, is that this would actually be interpreted as a losing variation! They would throw the whole test idea out of the window and test something completely different.
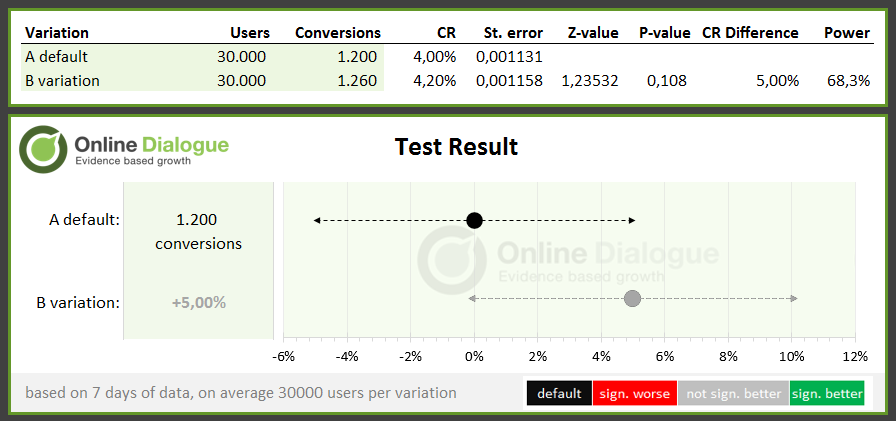
However, there seems to be a positive movement (the measured uplift is 5%), but it’s simply not big enough to recognize as a significant winner. You probably only need a few more conversions (or a higher sample size).
The test idea is actually pretty good, but only needs some tweaking.
With frequentist testing the goal is thus on finding true winners: you need to prove the alternative hypothesis without a shred of a doubt (ok a tiny shred of 5 or 10%). You want to take as little risk as possible. This is not so surprising if you take into account that t-tests have been used in a lot of medical research, as well. Of course you don’t want to bring a medicine to the market if you’re not 100% sure that it won’t make people worse of kill them. Then you really want to minimize the level of risk. However, that’s not the way to grow your business.
You need to take some risk in order to bring in more revenue.
What’s the Alternative?
A Bayesian approach to evaluating A/B tests has grown immensely in popularity over the last couple of years. And most renowned A/B test software programs now use (at least some form of) Bayesian statistics to evaluate test results: Google Optimize uses Bayesian statistics, VWO recently switched to Bayesian decisions and Optimizely’s Stats Engine uses flavors of Bayesian statistics as well.
And that’s not without reason: Bayesian statistics makes more sense, since it far better suits the underlying business question.
Bayesian statistics doesn’t use a null hypothesis, but addresses the business question directly: what is the chance that B is better than A?
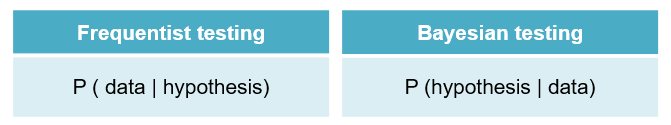
With using a Bayesian approach the counter-intuitive definition of a p-value gets avoided. Instead of defining the probability of the observed or more extreme outcome, given that the null hypothesis is true (data | hypothesis), the posterior probability can be determined: the probability that the hypothesis is true, given the observed data (hypothesis | data). And that is exactly what we are looking for in A/B testing: what is the chance that B is better than A, given the observed data in the test?
A Bayesian Test Evaluation
When you use Bayesian statistics to evaluate your A/B test, then there is no difficult statistical terminology involved anymore. There’s no null hypothesis, no p-value or z-value, et cetera. It just shows you the measured uplift and the probability that B is better than A.
Pretty easy right? Everyone can understand this.
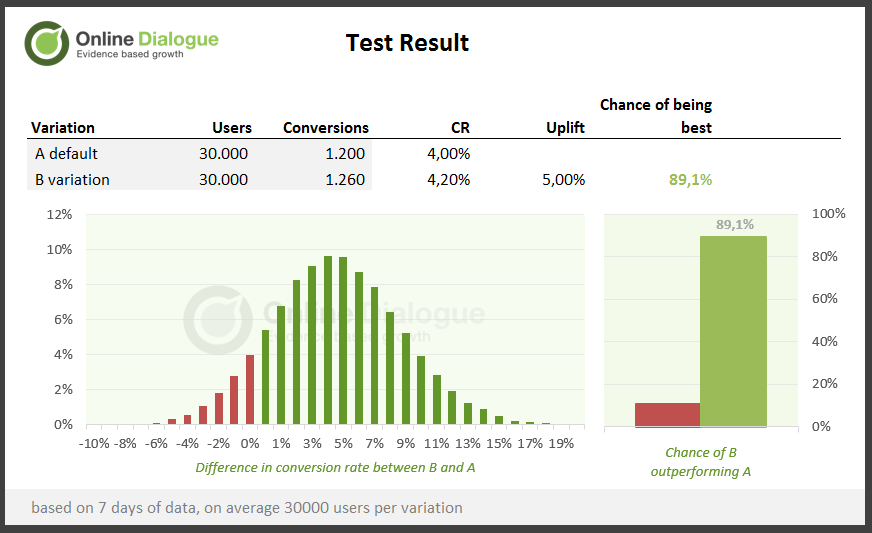

Based on the same numbers of the A/B test I showed you earlier, you have a 89.1% chance that B will actually be better than A. Probably every manager would understand this and will like these odds.
When using a Bayesian A/B test evaluation method you no longer have a binary outcome, but a percentage between 0 and 100% whether the variation performs better than the original. In this example 89.1%. So instead of saying “we could not reject the null hypothesis that the conversion rate of A is equal to that of B with a p-value of 0.102,” we can state “there is a 89.1% chance that the conversion rate of A is better than B.”
Which do you prefer?
Let’s Place That Bet!
The question that remains: should you implement this variation? Now with Bayesian analysis you can make a risk assessment. You can calculate what the results mean in terms of revenue when you were to implement the variation.
The average uplift in revenue (all the green bars in the example together) can be multiplied by the average order value and extended to 6 months time (this is just a ballpark, because we don’t really know how long the implementation will drive revenue). And the same can be done for the average drop in conversion rate (all the red bars added up).
In this example this means that this client has a 10.9% chance of losing money (around 200 thousand) when they implement the variation, but also a 89.1% chance that it will increase revenue (of around 660 thousand). Probably every manager would like these odds and implement the variation.
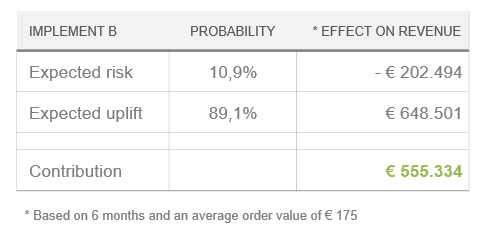
In conclusion, with a Bayesian test evaluation the risk of implementing non-significant test variations is mapped out. Every test results in a risk assessment, where the expected extra revenue is evaluated against the risk that the variation actually underperforms. The positive effect is that more variations will be implemented, resulting in a higher revenue growth.
How Much Risk Should I Take?
Depending in the type of business you are in you may be more or less willing to take risks. If you are a start-up you might want to take more risk than a full grown business. We human beings are known to be risk averse and don’t like odds of losing money, so what we see with most of our clients that they prefer a probability of at least 75%.
This probability is not a fixed number, but may vary depending on the type of test. If you only changed a headline then the risk is much lower, then when you need to implement a new functionality on the checkout page for instance. This will consume much more resources. Hence, you will need a higher probability in order to decide to implement the variation.
DIY!
Recently we turned this Bayesian Excel calculator into a web tool as well. It’s free to use for anyone. Check it out here. You can input your test data and calculate the result. It will return the chance that B outperforms A, the distribution of the posterior simulation of the difference between A and B and the risk assessment.

Conclusion
To sum up, using Bayesian statistics to evaluate your A/B test results has a lot of advantages over using frequentist statistics:
- It’s easier to understand: there’s no difficult statistical terminology involved anymore.
- It better suits the business: it will tell you the probability that B is better than A and you can make a proper risk assessment based on the test at hand.
- You don’t throw away good test ideas that are indicatively significant.
- You will have a higher implementation rate and revenue growth, because you don’t stick to implementing clear winners, but also implement variations which have a high chance of earning you more money.
- You will have more energy in your test team and higher visibility in the organization, which leads to a successful A/B test program!
Related Posts
-

A/B testing is highly useful, no question here. But a lot of businesses should not be…
-
There's a philosophical statistics debate in the A/B testing world: Bayesian vs. Frequentist. This is not…
-
A/B testing is fun. With so many easy-to-use tools, anyone can—and should—do it. However, there's…
-
A/B testing splits traffic 50/50 between a control and a variation. A/B split testing is…


Hi Annemarie,
Clear and interesting aricle!
At our company, we are also debating which type of statistics suits our business and CRO processes better. As you mention, I can see the benefits of Bayesian statistics, especially the fact that Bayesian is giving more insight on potential risk/uplift instead of providing a confidence level.
However, I’m still struggling with accepting test results at a lower chance of beating the control. When I’m comparing the chance of beating the control that is provided by Bayesian statistics vs. the confidence level provided by frequentist statistics, I’m seeing the same percentage.
So, by accepting lower chances of beating the control with Bayesian, aren’t we just ignoring our level of confidence from frequentist statistics? And aren’t we building a suboptimal version of our websites, since the variants are accepted at a lower confidence/chance of beating the control and are therefore suboptimal themselves?
Thanks in advance!
Hi Sander,
That’s a fair point to make. If you accept probabilities lower than 95% (which is indeed more or less aquivalent to a significance level of 95%) then you take more risk. It may be that you will therefor implement a suboptimal variation. But if you don’t have the resources or time to test more variations to find the best vartiaion, then this is still better than keeping the original.
If you accept lower probabilities the number of implementations will be much higher (I did a simulation and in stead of 25% implementation rate, we had a implementation rate of almost 40%). Some of those implementations actually won’t make you more money, but the vast majority will – resulting in a higher revenue growth than just sticking to implementing variations with 95% significance.
And you should keep in mind that even with frequentist statistics you have a certain risk (the false positive rate): if you use 90% significance, 1 in 10 won’t be a real winner. If you implement everything with a probability higher than 80%, then 1 in 5 (statistically) won’t be a winner, but the number of absolute implementations is higher.
If you have the traffic numbers and luxury of enough resources to test everything then you might not want to take as much risk (and stick to 90 or 95% probability), but if you don’t then accepting lower probabilities is the way to go in my opinion.
Best, Annemarie
Thanks Annemarie, I completey agree with your explanation!
You’re welcome! And good to hear you share the same opinion!
Hi Annemarie,
It’d be great if you could share an excel for this method, just like you have for the frequentist method. Are you planning on doing that?
Best,
Hi John,
I’m sorry, but we’re not planning to freely release the Excel version. Mainly because it’s a very heavy file: whenever we run it in our office the internet radio starts to stutter :-). The calculations behind Bayesian stats take a lot more processing than the frequentist version. But that’s why we launched abtestguide.com/bayesian!
Hi Annemarie, great article thanks. Regarding your web tool and this calculation, is calculation the required sample size done the same way for the Bayesian approach as a frequentist approach? I..e your calculator gives a 86% change of a winner with just a 100 users per variation and 2 vs 5 conversions.
Hi Auke,
Thanks for your reply and the great question. If you use very low sample sizes then a basic assumptions of doing this Bayesian calculation isn’t met. The Central Limit Theorem still needs to be met (you need this for frequentist stats too), which means that you need a sample size that is large enough to make the distribution of the variations look normal (nice symmetrical bell shaped curves). With 100 visitors and 2 (or 5) conversions you don’t meet this criteria. If you would plot these distributions you would see that these are right-skewed and not symmetrical.
(in the Bayesian calculator you can also see that the Posterior simulation of the difference is almost flat: the real difference in conversion rate still can be anything. The higher the sample size, the smaller the width of this graph and the more certain you are of the actual uplift). The provided calculator is a different way to look at your results, but the experiment set-up isn’t changed.
Hi Annemarie, thank you for the detailed and informative article!
But, I still don’t get the main message: You state that the “Chance to beat Control” is something you can only get with Bayesian Statistics, which simply is not true.
Every Chi-Square or T-Test also provides that value. VWO or Optimizely showed that value for years. It is the key value that we use for hundreds to tests so far. Nobody who uses the tool must know anything about the underlying statistical models, as long as he knows what a CTBC of 81% means…
Best,
Thorsten
Hi Thorsten,
You are right that VWO and Optimizely have been using the term CTBC for a long time, but they actually misused the term (they admitted this as well). With a t-test or Chi-Square test, you cannot determine the CTBC. You can only calculate the p-value, which only states how unlikely it is that you found this result, given that the conversion rates are exactly the same. So, the p-value is often misinterpreted as the CTBC. Only with using Bayesian statistics you can truly determine the CTBC.
VWO and Optimizely now use Bayesian statistics (or a form of), so luckily this no longer is an issue. We always integrate our A/B-test with the analytics software (we believe it’s best to align with what collection and analytics reporting you run your business on – so you can compare apples with apples. And the analytics data is far richer than that of the test software), so we do the calculations ourselves. We developed our own Bayesian calculator for that reason.
Thanks for the clarification, Annemarie!
Hi,
I am trying to use your online tool but struggling to understand
1) how to fill in the “Min. revenue yield in 6 months” field
2) how to interpret the “contribution” that is obtained afterwards
Can you clarify please?
Thanks!
Hi,
1) the minimum revenue yield in 6 months time would be the revenue uplift you at least need in order to implement the variation. You might not be happy with an uplift of only 0,5%, but need at least an uplift of 2% (in money terms 25.000) to justify the resources is takes to implement it. The calculator will then return the probability that the test will make you 25.000 in 6 months time.
2) The contribution is calculated as follows: [probability_win] * [uplift] + [probability_loss] * [drop]. If the contribution of the test is higher than 0, you are more likely to earn money than losing it.