
“Statistics are like bikinis. What they reveal is suggestive, but what they conceal is vital,” said Aaron Levenstein, a former professor of business administration at Baruch College. [Tweet it!]
The same is true of your data in Google Analytics. Most of what you spend your time looking at (and re-looking at) is merely suggestive.
That’s not the data you want to be analyzing and drawing insights from. You have so much data available to you, but only a fraction of it will help you optimize and make better business decisions.
The most actionable, useful data is concealed and can be revealed only through custom reports and segmentation in Google Analytics.
Table of contents
- How to use custom reports in Google Analytics
- Acquisition custom Google Analytics reports
- SEO custom Google Analytics reports
- Ecommerce custom Google Analytics reports
- Social media custom Google Analytics reports
- PPC custom Google Analytics reports
- Conversion rate optimization custom Google Analytics reports
- Technical / quality assurance custom Google Analytics reports
- Conclusion
How to use custom reports in Google Analytics
Many Google Analytics custom reports are configured incorrectly. More often, Google Analytics configurations are broken, rendering custom reports even less effective. Before you begin experimenting with custom reports, conduct a Google Analytics health check.
Once you’re sure your analytics are healthy, you can begin trying to understand the five key elements of custom reports: users, sessions, hits, metrics, and dimensions.
- Users: A segmentation level option. This is the broadest level; each individual person is a unique user.
- Sessions: A segmentation level option. Most users make multiple visits, which is known as a “session.”
- Hits: A segmentation level option. Within each “session,” there are hits.
- Dimensions: Every report is made up of dimensions and metrics. Dimensions describe characteristics (e.g., geographic location or browser).
- Metrics: Every report is made up of dimensions and metrics. Metrics are quantitative measurements (e.g., sessions or conversion rate).
There are also three different report types: explorer, flat table, and map overlay.
- Explorer: This is the basic report. It includes the line graph and the data table below, which you’re very familiar with.
- Flat table: This is one of the most common custom report types. It’s essentially a sortable data table.
- Map overlay: This is simply a global map with colors to indicate engagement, traffic, etc.
Of course, there is the Google Solutions Gallery, which allows you to choose from dozens of user-made custom reports, advanced segments, and dashboards with the click of a button. However, for best results, you should understand how each report was configured and why.
So, why use Google Analytics custom reports? Primarily because there is a lot of data available to you. Sorting through it manually and trying to analyze it for insights can be incredibly time-consuming. Custom reports collect the data and present it in a way that makes it easier for you to analyze.
But what are you analyzing for? If you go into Google Analytics without the right questions in mind, you’ll get lost after hours of unguided searching. As W. Edwards Deming said…
If you do not know how to ask the right question, you discover nothing.
Start by conducting heuristic analysis. (For more information on heuristic analysis, read through the ResearchXL model.) After heuristic analysis, you should have a list of questions you need to answer. Like…
- Does the site look good in all browsers? On all devices?
- Why is the post-purchase page loading slowly?
- Are button clicks being tracked?
- Is anyone actually using XYZ?
Your list will be much longer. Use these questions to guide your Google Analytics exploration and give you purpose.
Now, there are two things to remember when choosing or creating a custom report:
- Choose representative, useful metrics;
- Everything is better with segmentation.
You should have acquisition metrics, behavioral metrics, and result metrics no matter what. You want to get a full end-to-end picture, so create custom reports that give you that.
Also, segmentation can be applied to custom reports the same way it can be applied to the basic Google Analytics reports. Take advantage of that to make your custom reports even smarter. (For an in-depth guide to Google Analytics segmentation, click here.)
Acquisition custom Google Analytics reports
1. Metrics by day of week name and hour
Author: Bounteous (formerly LunaMetrics).
Where to find this report: You can import it from the Google Solutions Gallery.
Your traffic behaves differently depending on the day of the week and the time of day. This custom report gives you insight into those behavioral changes. You can switch the metrics out at any time to change the report and dive deeper.
Here’s what the day of week and hour custom report looks like behind-the-scenes…
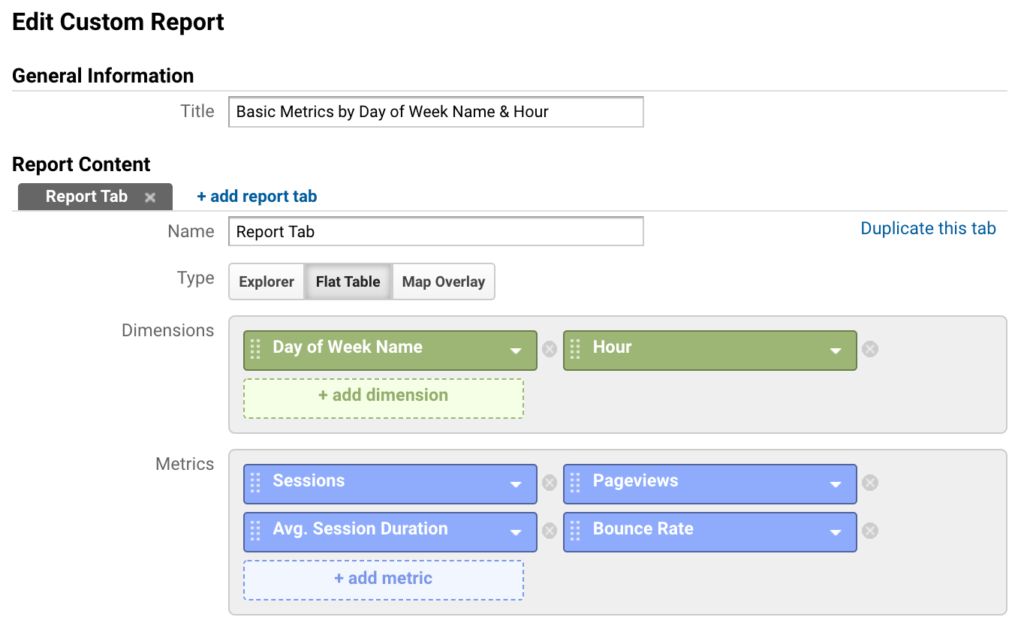
As you can see, “Day of Week Name” and “Hour” are automatically set as dimensions, and “Sessions,” “Avg. Session Duration,” “Pageviews,” and “Bounce Rate” as metrics to be displayed in the report.
Here’s the flat table that this report will generate…
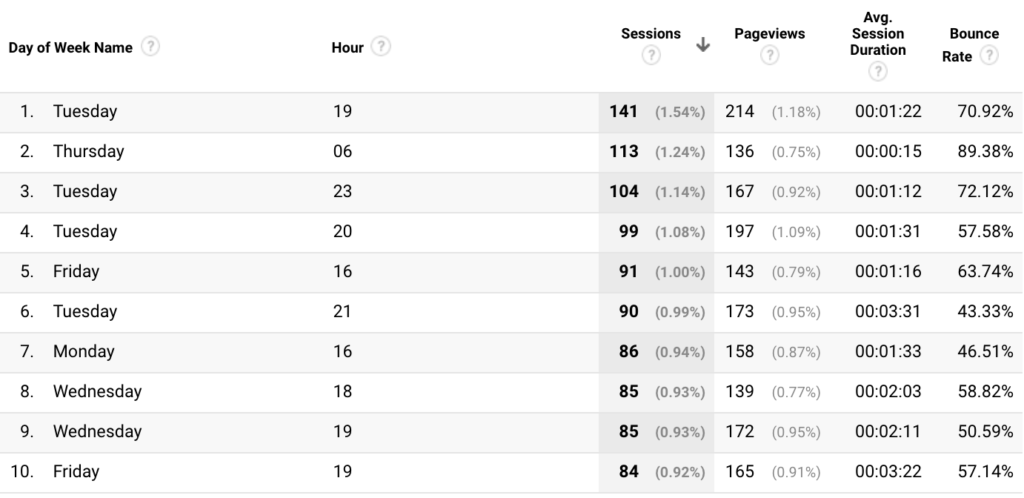
Remember, you can switch any of the pre-selected metrics out for any other metric, including conversion metrics and goal completions.
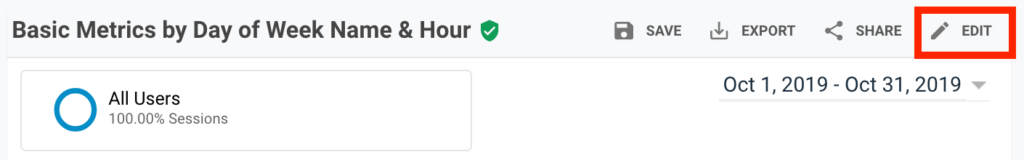
You can access this option using the Edit button at the top right corner of this report.
2. Visitor acquisition efficiency analysis report
Author: Avinash Kaushik created this report.
Where to find this report: You can import it directly by clicking here.
The larger your company is, the more likely it is that your growth/marketing team operates in silos. For example, Alex is responsible for paid channel, and Shanelle is responsible for social media, but they rarely speak or share insights.
To prevent that from happening, you can create this custom report, which allows you to analyze by traffic source. Note how you can “drill down” from “Source / Medium.” In practice, that means you can click on the specific source/medium to see the medium and campaign information…
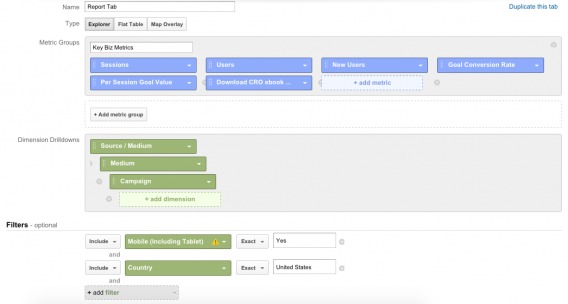
Here’s what the report will look like…
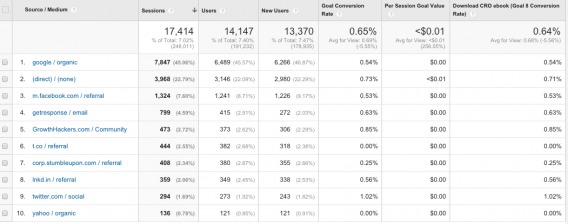
Note that you see acquisition, behavioral, and result metrics here.
Additional:
When you import this report, one column might display incorrectly. It uses “Goal 6,” which Avinash has set up as a way to measure engagement. If you’d like to do the same, here’s what you’ll need to do…
- Define what “engaged” behavior is to your company. For Avinash, it’s about X minutes spent on site, or Y pages viewed per session.
- Create a goal for that behavior.
- Add that goal to the report in place of Goal 6.
Above, I simply switched out Goal 6 for a conversion goal I was more interested in.
SEO custom Google Analytics reports
3. Long-tail converters
Author: Greg Habermann created this report.
Where to find this report: You can import it directly by clicking here.
Are you still trying to target and bid on queries that are one or two words long? Perhaps it’s because you don’t understand how valuable long-tail keywords are. To help, we can set up a custom report that analyzes your three, four, five, 10, 20 and 20+ word queries.
First, you’ll need to set up an advanced segment…
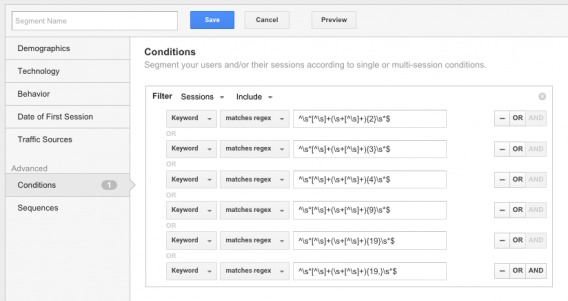
Here, we have a conditional segment. Nick Mihailovski from Google created the regular expressions above to isolate long tail keywords.
Now you can set up the actual report. It’s fairly straightforward and the metrics can be switched out to suit your configuration…
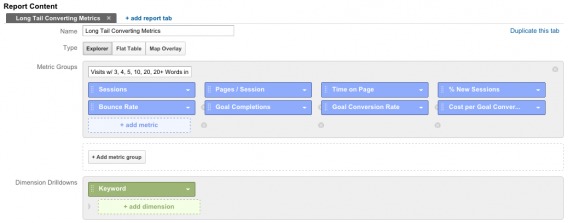
Essentially, you’ll be able to see how your long tail keywords perform, including how much money they make you. That can inform your content, SEO, and PPC strategies.
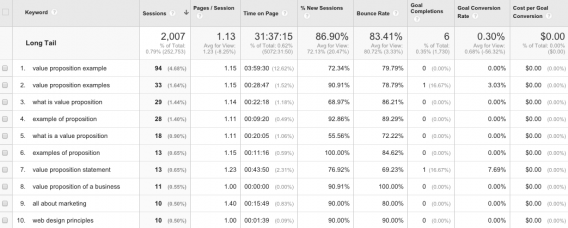
Here’s what the results look like…
Ecommerce custom Google Analytics reports
4. Daily ecommerce traffic report
Author: Justin Cutroni created this report.
Where to find this report: You can import it directly by clicking here.
If you’re running an ecommerce site, this report is essential for day-to-day use. It’s basic, but gives you a complete at-a-glance overview of your performance by source.
Here’s the behind-the-scenes look…
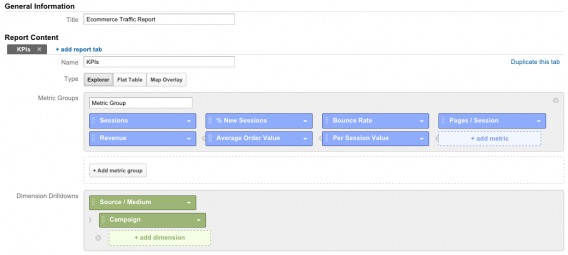
Pretty straightforward, right? I’d also suggest adding the conversion rate metric in there, but that’s just me.
Note that when you drill down, you’ll be able to see specific campaign information.
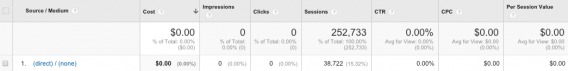
Here’s how your report will look…
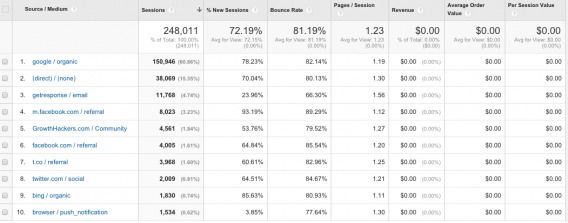
“Average Order Value” and “Per Session Value” are particularly powerful here. They allow you to measure close to the money and understand how buying behavior changes depending upon the traffic source.
Social media custom Google Analytics reports
5. Social media performance analysis report
Author: Avinash Kaushik created this report.
Where to find this report: You can import it directly by clicking here.
If there’s one thing people love to say about social media, it’s that it’s difficult to measure. “We know it sends us traffic, but we’re not sure how that translates to dollars in the bank.” In reality, measuring the value of social media is quite straightforward.
However, it is incredibly time-consuming due to the way Google lays out the basic reports. This report will make you a much more efficient analyst.
We’ll have three tabs: summary, content analysis, and device analysis.
Let’s start with the summary…
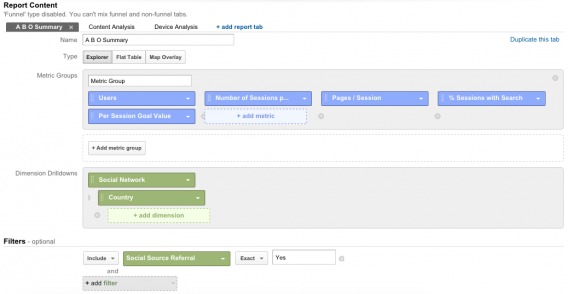
This will tell you where they’re coming from, how often they come, whether they find what they’re looking for, and whether they make you money.
Avinash Kaushik, author of Web Analytics 2.0, explains the “Social Source Referral” filter…

Avinash Kaushik, Web Analytics 2.0:
“Do notice the clever use of the filter (Social Source Referral Exact Yes) above. I want to give the Google Analytics team big love for this life saver. It was deeply frustrating to keep track of social networks (they come and go every day!). Now with Social Network dimension and Social Source Referral filter, you don’t have to worry about it. Uncle Paul is keeping track of it on your behalf! Give him a hug next time you see him.” (via Occam’s Razor)
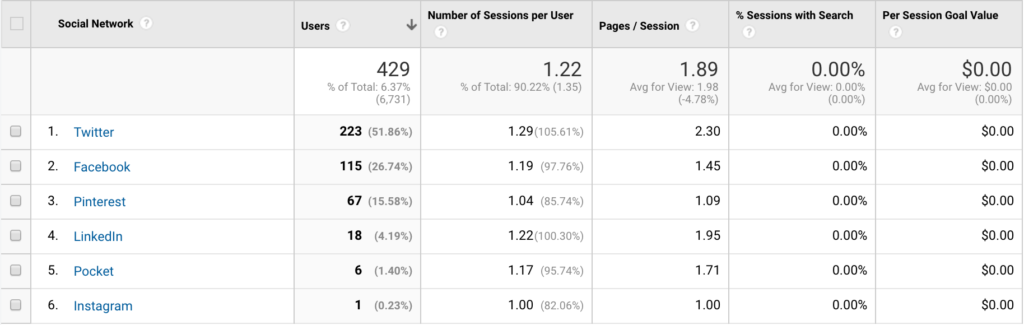
Here’s the report…
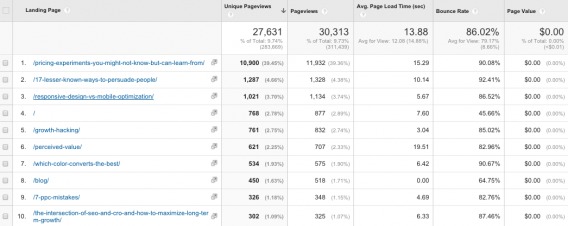
Next, the content analysis…
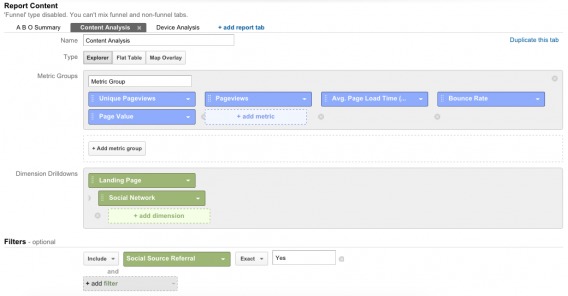
Instead of measuring tweets and shares, we’re going to measure actual business results. This tab will tell you what landing pages are most popular, what types of content are the most valuable. Then, you can drill down to see what social networks do the heavy lifting per landing page…
Next up, the device analysis tab…
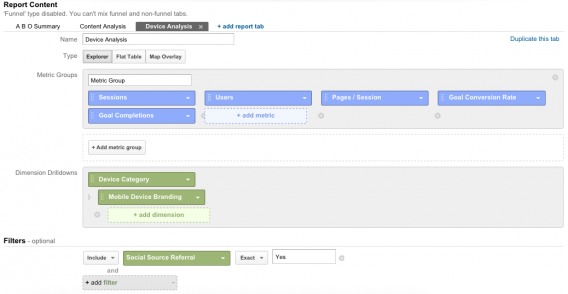
Let’s say you’re running social ads. This part of the report could be particularly helpful to you since you can target your ads based on device. Should you can more about mobile? Desktop? It doesn’t matter how many sessions and users are referred. What matters is how valuable those sessions and users are once they land. Use that knowledge to inform your strategy.
Here’s the report…
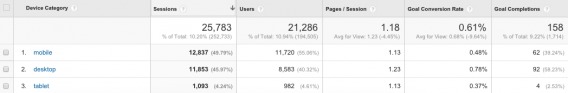
We see marginally more mobile social traffic, but desktop social traffic converts much, much better. Custom reports help you see the whole picture exponentially quicker.
PPC custom Google Analytics reports
6. PPC campaign goal performance
Author: Rachelle Maisner created this report.
Where to find this report: You can import it from the Google Solutions Gallery.
This report lets you analyze paid search performance against goal conversions by search engine, which is incredibly powerful if you advertise often and across multiple engines. Here’s how it’s set up…
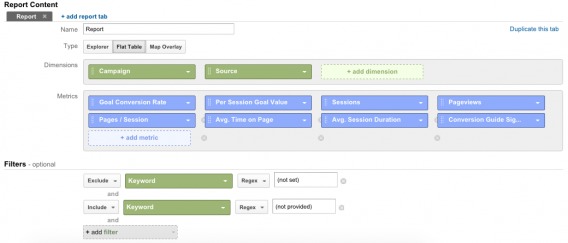
So, we’re looking at both campaign and source, which means we can see specific campaigns you’ve created, as well as the search engine they’re deployed on. Then, we can see whether those users are taking actions or going cold once they’re on-site.
Here’s how your report will look…
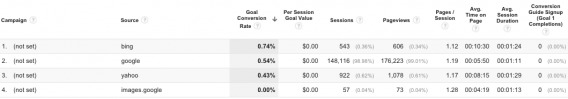
We don’t do a lot of PPC at CXL, so assume that your report will be a bit more well-rounded.
Additional:
Note that the last column is “Goal 1 Completions.” Rachelle suggests changing this to your engagement goal (Avinash references this above).
Also, this report focuses on Google campaigns. Above, I’ve removed the source filter to see data from all search engines vs. just Google. You can do the same or leave it as Google-only.
7. PPC keywords
Author: Rachelle Maisner created this report.
Where to find this report: You can import it from the Google Solutions Gallery.
Now that you know how your paid search efforts are doing on a higher level, you can drill down to keyword-level data. This report will give you traffic volume, CPC, goal conversions and cost per conversion for each keyword.
Here’s the behind-the-scenes…
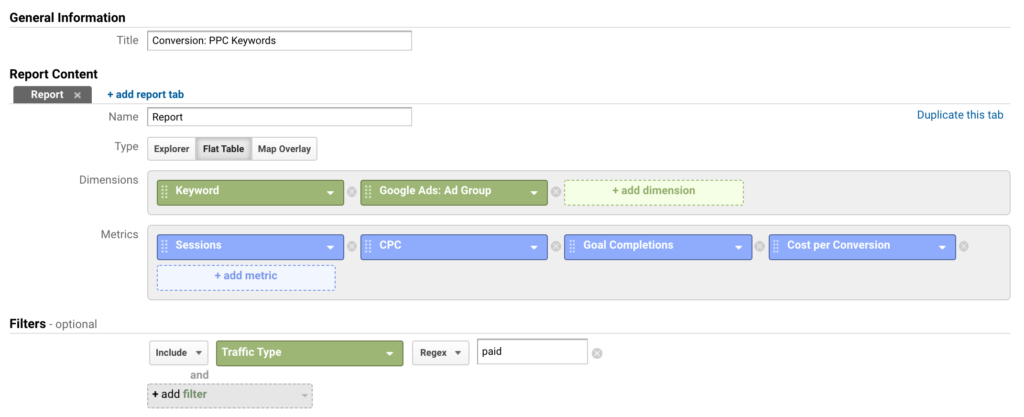
Here’s what your report will look like (sans data)…

I’ve seen this report quite often, but I like Rachelle’s version because it includes “Ad Group” as a dimension. Anyone who does a lot of PPC work knows that that is incredibly important to organization and analysis.
8. Campaign cost analysis
Author: Avinash Kaushik created this report.
Where to find this report: You can import it directly by clicking here.
So far, we’ve done a pretty good job of measuring close to the money (revenue, conversions, and so on). However, what we’re not taking into account is the cost of what we’re doing vs. the value of the results. In other words, revenue minus marketing and acquisition costs (i.e. profit).
Here’s the report setup…
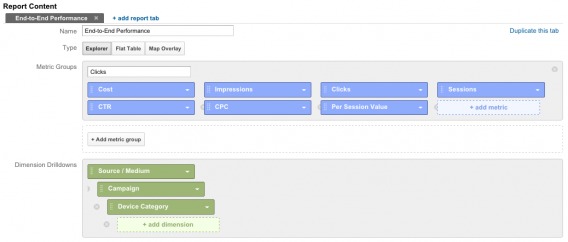
Note that for the most part, it’s a typical end-to-end performance custom report. It will show you how much you’ve spent, how many people saw your ads, how many clicks they received, resulting traffic volume, your CTR, the CPC and the value of each resulting session.
Here’s what the report will look like…
Due to the nature of CXL, your data will be more robust. (Promise.)
The difference between “CPC” and “Per Session Value” should be your focus. If your CPC is $1.33 and your per session value is $1.66, which is the case for Avinash, you don’t have a net positive outcome. Sure, you’re making $0.33, but factor your salary in there. Overhead costs. The list goes on.
Your goal should be to widen the gap between those two numbers.
Additional:
Note that while we focused on PPC above, you can bring in all other paid efforts as well…
Avinash Kaushik, Web Analytics 2.0:
“You can import cost data for all your paid efforts into Google Analytics. For email. For a billboard if you have cleverly added a url there. For display. For social.” (via Occam’s Razor)
Conversion rate optimization custom Google Analytics reports
9. Event interaction by category, action, and label
Author: Bounteous (formerly LunaMetrics) created this report.
Where to find this report: You can import it from the Google Solutions Gallery.
In basic Google Analytics reports, you can choose two dimensions. Here, we’ll choose three: event category, event action, event label.
This will allow you to see how often people interact with your site. You’ll be able to do some powerful comparisons here as well, which will show you what categories and actions are more desired and effective.
You also have the opportunity to conduct some quality assurance here. Are “Total Events” and “Unique Events” aligned? If something seems incorrect or “odd” or “too good to be true,” it probably is. Now is the time to look into it.
Also, are there any events without any interactions whatsoever? Likely a sign that something is wrong with your tracking.
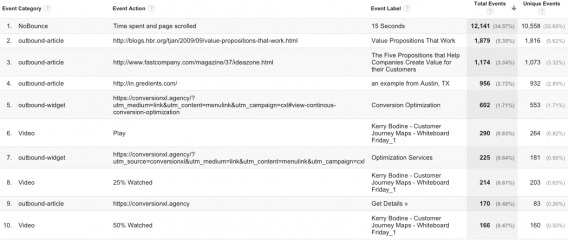
Here’s the setup…
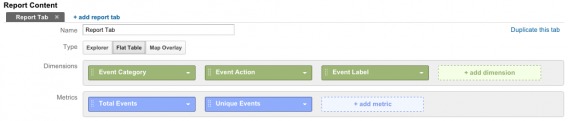
Extremely basic, but quite valuable. Take a look…
10. Conversion rate by browser and device
Author: Craig Sullivan created this report.
Where to find this report: You can import it directly by clicking here.
Speaking of quality assurance…

Peep Laja, CXL:
“This helps you identify any technical or UX issues for a specific browser and/or devices. If your website doesn’t work properly with the device/browser a visitor uses, they won’t buy! Any issues identified here are low-hanging fruits.” (via CXL)
With that in mind, here is the behind-the-scenes of the report…
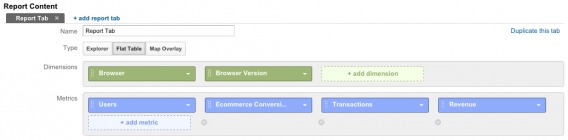
Once you save the report, be sure to add tablet, mobile, and desktop traffic as segments. Now, you’re looking at traffic volume, conversion rate, transactions, and revenue based on browser, browser version, and device type.
Here’s the report…
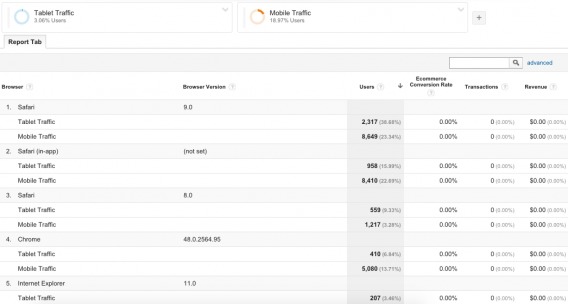
You can use this custom report to identify and prioritize UX issues.
11. Conversion rate for visitors who searched
Author: John Ekman created this report.
Where to find this report: You can import it directly by clicking here.
As an optimizer, you’re likely familiar with the concept that users who use site search are more valuable. But how much more valuable, really? You can read the stats or you can use this report to find out for yourself…
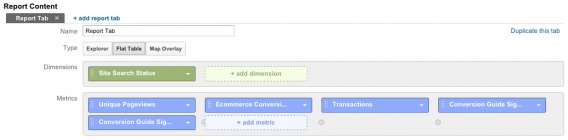
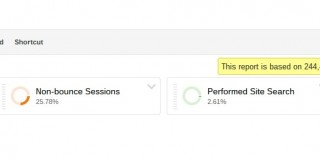
Pretty simple setup here. All we’re looking at is whether they used site search (yes/no) and some basic on-site behavior. The report will look something like this…
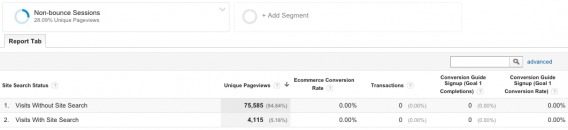
Be sure that you’ve activated the “Non-bounce Sessions” segment as well. Bounces have a 0% conversion rate. So, if you include them, you’ll distort your data.
For most sites (not all, as you can see above), site search is popular with users and overlooked by marketers. How can you make site search more prominent? How can you make site search smarter? More intuitive? These are the types of questions you begin to ask when you truly see how valuable site search is.
Additional:
John Ekman of Conversionista! explains how you can use site search data to identify new business opportunities as well…

John Ekman, Conversionista!:
“If you want to dig deeper, start mining your internal site search data for misspellings which are unmatched in your results or products which visitors look for but you currently don’t have in stock. Internal site search queries are the best tools for finding new business opportunities with your existing customers.” (via CXL)
Technical / quality assurance custom Google Analytics reports
12. Site speed metrics by browser and browser version
Author: Bounteous (formerly LunaMetrics) created this report.
Where to find this report: You can import it from the Google Solutions Gallery.
If you care about UX (and you should), you care about site speed. Which browsers are experiencing slow load times? Which versions of those browsers are causing the most damage?
Here’s the report setup…
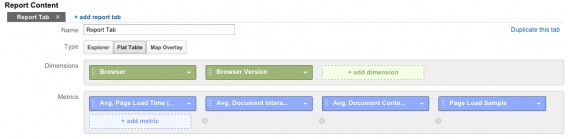
If it were me, I would add conversion rate and revenue metrics. That way, not only do you know exactly where you’re leaking money, but you know exactly how rapidly you’re leaking money as well. That will allow you to prioritize your patching.
Here’s what the report will look like…
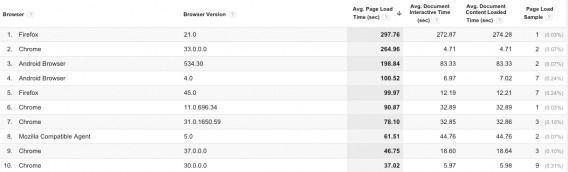
It’s sorted highest-lowest “Avg. Page Load Time (sec)” so that you can instantly see your biggest problem areas.
Conclusion
Custom reports, combined with advanced segmentation, reveal the useful data that is so often concealed or buried within basic Google Analytics reports. [Tweet it!]
While you can easily import custom reports you think you should have from the Google Solutions Gallery, it’s more valuable if you truly understand how custom reports work, how to create them yourself and how to use them to isolate useful data.
Here’s what you need to remember about Google Analytics custom reports…
- Understand how users, sessions, hits, dimensions, metrics, explorer, flat table, and map overlay work.
- Conduct heuristic analysis to develop a list of questions you need answers to.
- Use those questions to guide your Google Analytics exploration.
- Use the custom reports above (you can customize the metrics and dimensions to suit your business) or create your own.
- If you create your own, be sure to use acquisition metrics, behavioral metrics, and result metrics. Stay as close to the money as possible (e.g., revenue, profit).
- Remember that segmentation makes Google Analytics much more powerful, and data more useful.
Working on something related to this? Post a comment in the CXL community!
Related Posts
-

Knowing where to segment your Google Analytics data can be daunting. Where do you start? And…
-
Google Analytics is widely used. But most marketers only scratch the surface when it comes…
-
Google Analytics helps us identify conversion uplift opportunities. Traffic is precious, and we don't want…
-
This post is not a dry feature-by-feature comparison, nor does it include a winner-take-all verdict.…


Liked The Way of Presentation & Lovely Content.
Thanks Prem! Glad you liked the article.
Very useful. Thank you very much :)
And thank you for reading! :)
Hey Shanelle,
Great post. This is something that I don’t know a lot about, but I really did enjoy the post. Clearly, I need to do much more than check my analytics once a week. This post helped me realize I need to up my game too.
Thanks for this.
– Andrew
Thanks for reading, Andrew. Glad I could help.
Are you using any custom reports right now? What type of site do you manage?
These are awesome Shanelle, the crew at CodingIsForLosers should build these into google sheets templates like we did with some of Avinash’s custom reports.
Thanks for reading! Glad you liked the article.
Very Useful ! I love it. Thank you
Happy to help! Thanks for reading.
Really nice post, i thought i was pretty good with Google analytics but learnt a lot about from this post. Thanks for this wonderful post.
Thanks Kaycee! Glad I could help.
Let me know if you have any questions about what you read.
Hi Shanelle –
This is a great article – thanks for putting this together. I did want to point out that GA is getting rid of the Data Hub and much of the social metrics very soon. It may effect the Social Media Performance Analysis Report. Thanks again!
T
Thanks for reading and for the heads-up, Theresa.
Thanks for sharing, this helped me to use google analytics in a new way. Head upon this.