To assess the State of the Conversion Optimization Industry in 2018, we gave a 26 question survey to 701 people who work in the optimization space.
This year we partnered with VWO, a leading A/B testing & conversion optimization platform used by over 6,000 clients in 90+ countries. This partnership resulted in a great success as we were able to reach more than double respondents compared to last year (701 vs. 333).
This is the third issue of our report (the first was published in 2016) and—with three datasets available—we begin to see some trends.
This post outlines some of our findings. You can download the full report for free here.
Some major findings this year:
- Global trends for prioritizing and investing in CRO;
- Which industry (Ecommerce, Lead Gen, SaaS, Agencies) is investing more in CRO;
- The biggest struggles of CROs;
- How much CROs make (by industry and work experience).
Let’s begin…
Demographics: The profile of an optimizer
Gender
CRO professionals are mostly male. The imbalance was evident in 2016, and the trend seems to be continuing (at least in our sample population). The female CRO population decreased from 27.6% (2016) to 17.3% (2018).
Age group
Concerning age, there is no big change from the previous year. Almost 50% of the CRO population is in the 30–40 age group.
Female CROs seem to be younger; they’re equally distributed in the age groups 20–30 and 30–40.

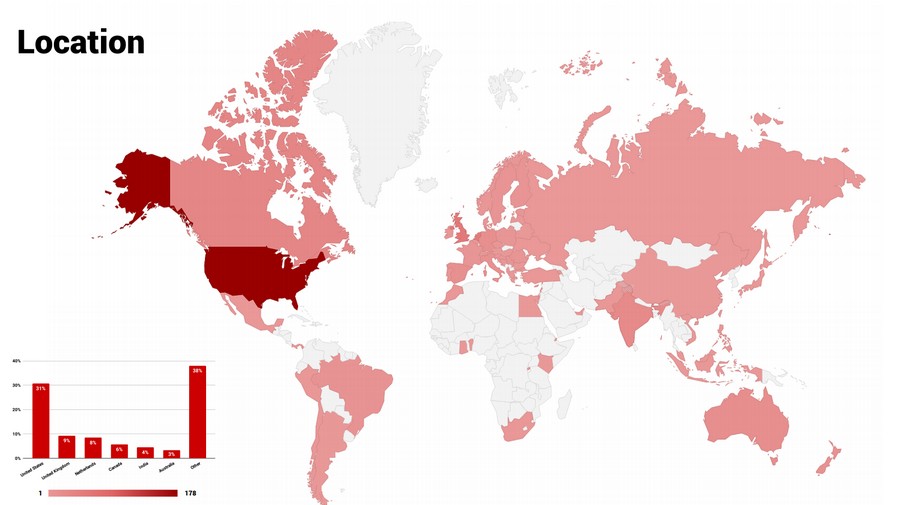
Location
While a plurality of survey responses came from the United States (30.6%), we received responses from 68 Countries.
Four countries—United States, United Kingdom, The Netherlands, and Canada (ordered by number of respondents)—account for 54% of all responses.
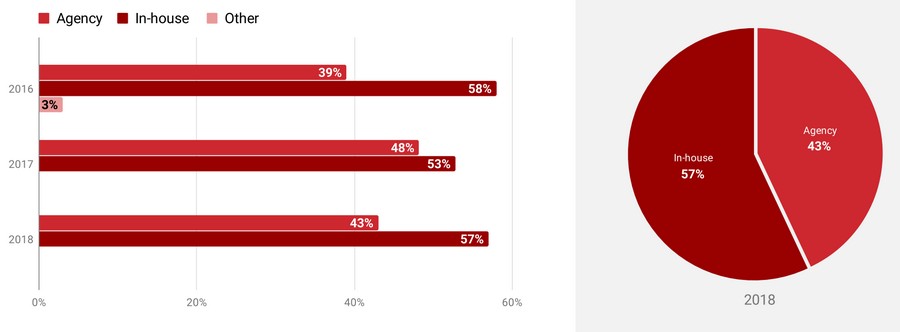
Company type
The proportion of CRO professionals working in-house and those working at an agency (or freelance) has remained stable throughout the three years of the survey. This year, 56.7% reported working in-house; 43.3% work with clients.
Most CROs work at an agency (or as freelancers) or in ecommerce. All other industries combined—SaaS, Lead Gen, Publishing/Media, Non-profit/Government) make up just 34.9% of the total.
We spotted one trend: The percentage of professionals working in ecommerce is decreasing while the percentage of those working in agencies (or freelancing) is increasing.
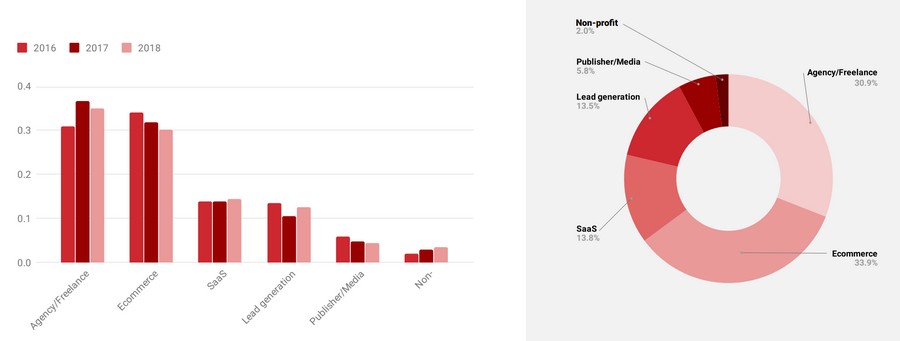
Note: We still do not have enough data on the Publishing/Media or Non-Profit/Government sectors, so we will not focus on those when comparing industry trends.
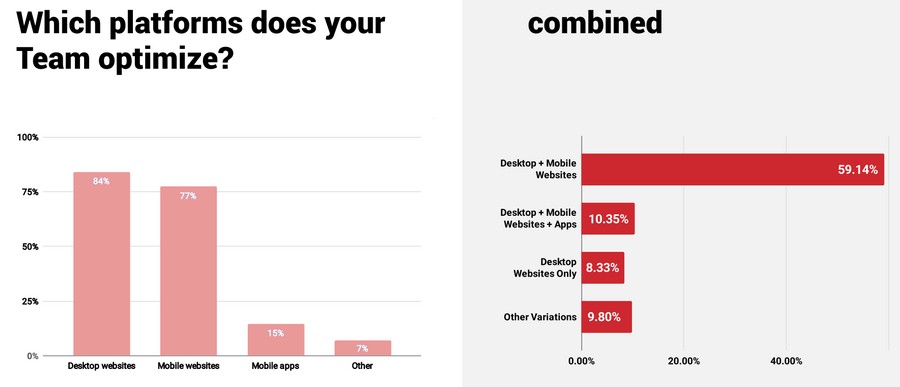
Most respondents (51.9%) work exclusively on optimization of desktop and mobile websites. As in previous years, very few optimize mobile applications.
Salary
In 2018, the average salary of CROs is $69,238 ($64,984 in 2017, $71,340 in 2016).

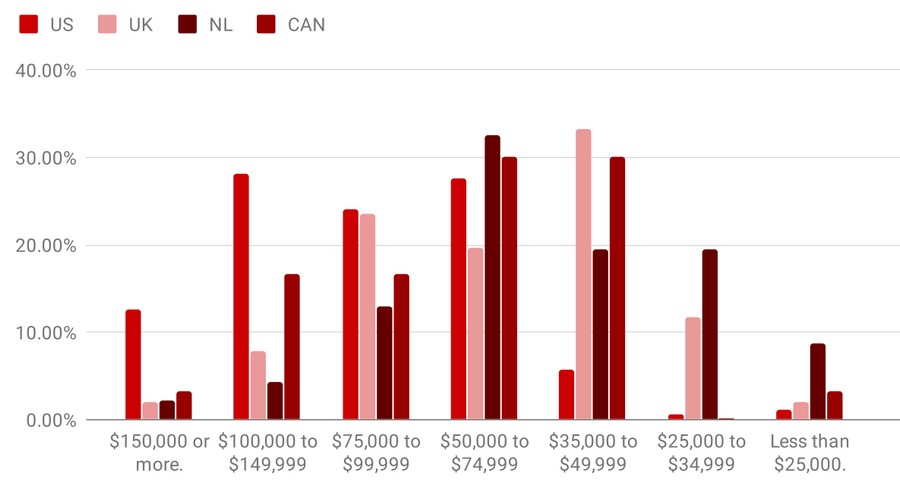
In 2016, the United States had the highest average salary at $87,926; in 2017, Australia took the prize with an average salary of $88,676. This year, the United States wins the crown with a whopping $95,431.
Among the top four countries (by number of respondents), the lowest salaries were in The Netherlands, where a CRO professional makes an average of $56,847.
By industry, SaaS companies pay more than others. CROs working in SaaS make an average of $84,294; no other industry reaches the $70k mark. The Publishing/Media industry has the lowest average pay, with a salary of just $48,750.
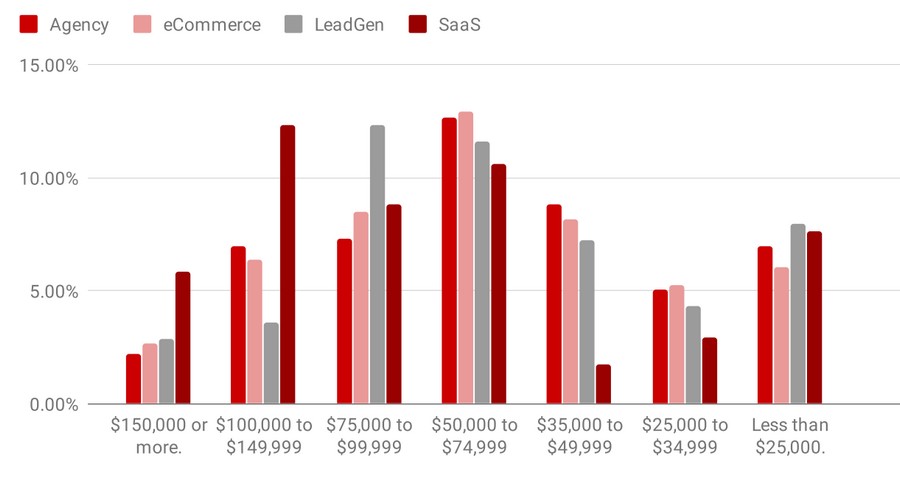
So, if you want to make big money as a CRO expert, should you be based in the United States and work in the SaaS industry? Yes! Survey data backs this up (brilliant), with 47 (wealthy) respondents in this very situation who make an average of $109,680 per year.
On the other side of the spectrum, you probably don’t want to live in The Netherlands and work in the Publishing/Media Industry: You would have just $49,166 to show for one year of CRO efforts.
But before you pack your things to move to the United States: Salary correlates strongly with experience:
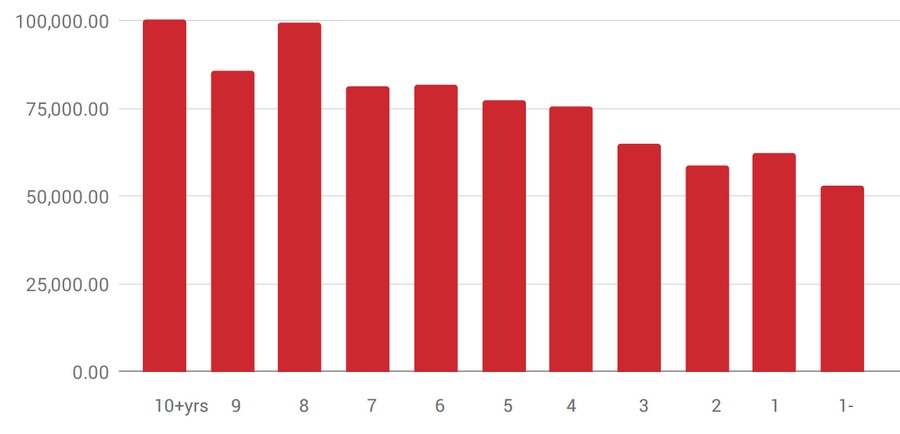
You need several years of CRO experience before you can score big numbers.
(If you want to expedite that personal development—and earn the commensurate salary—you need to know your stuff. At CXL Institute, we teach CROs the strategies and tactics of top practitioners.)
Work Experience
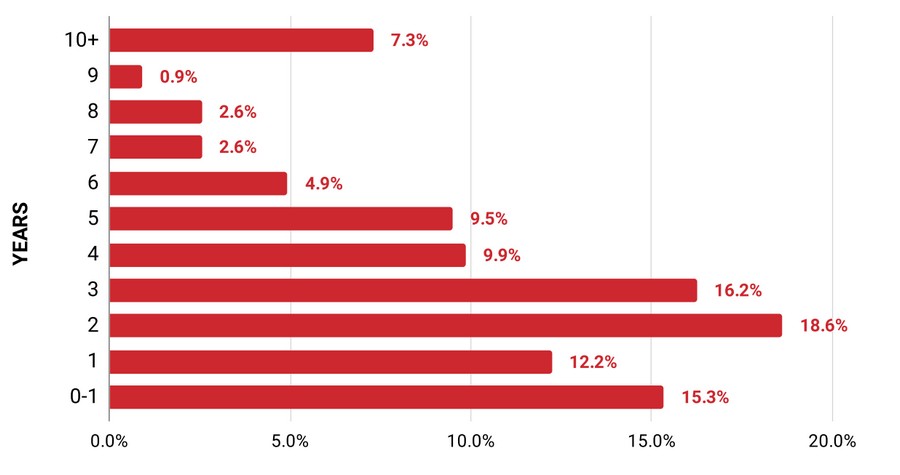
Speaking of experience, 62.4% of respondents have been working in the CRO space for less than 4 years and 81.7% for less than 6 years. CRO is still a very young industry.
The CRO process
A company is only as good as its processes. Processes achieve consistent, long-term results. But do you know what CROs reported as their biggest struggle in 2018?
The lack of a well-defined, efficient process.
Here are the relevant questions we asked:
- Who does optimization in your organization?
- How often do you meet with others on your optimization team to discuss CRO?
- Does your team have a conversion optimization process that you follow?
- Do you have a formal conversion/user-research process you use for extracting insights?
- Do you have a test prioritization framework that you follow?
- Approximately how many online experiments (tests) does your team run every month?
CRO and teamwork
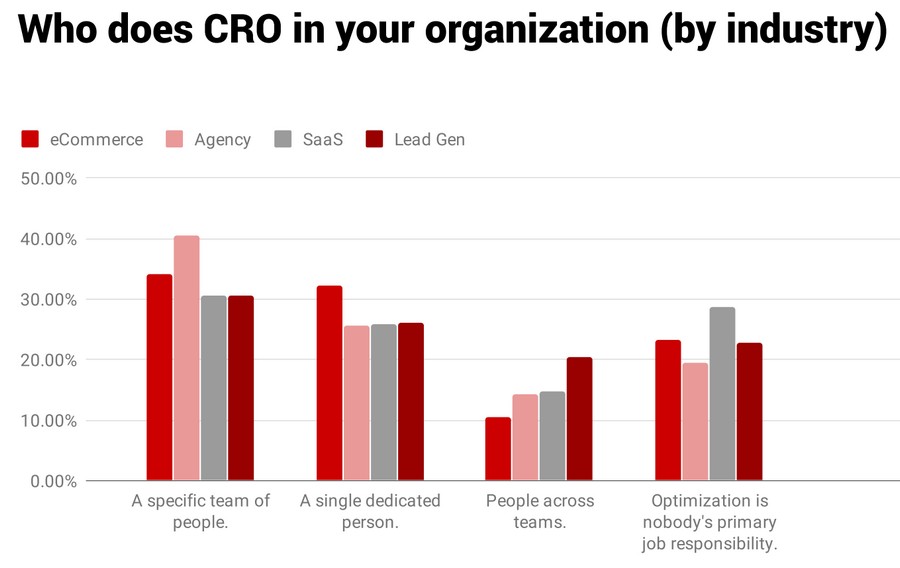
Companies take CRO seriously: In over 60% of cases, CRO is in the hands of a specific person or a dedicated team.

Across all industries, only 15.8% of respondents stated that “Optimization is nobody’s primary job.”
Ecommerce, SaaS, and Lead Gen companies are investing in CRO. Over 30% of respondents working in these industries report working on a CRO team (with 25% working independently on CRO).
Not surprisingly, agencies are the most likely to have a CRO team (40%).
CRO meetings
CRO meetings are most often held weekly..or not at all. Some 30.6% of respondents report weekly meetings, while 29.2% report meeting “only when necessary.”

Among those having at least one CRO meeting per week (daily or weekly), three industries stand out: Ecommerce (51.7%), Lead Gen (46.6%), Agencies/Freelancers (45.1%). All the other industries scored below average.
The CRO process in detail
When it comes to a CRO process, the SaaS industry lags behind. While 23.7% of companies have no structured process, the percentage of SaaS Companies with no process is 31.7%.
Ecommerce and Agencies are the most structured, beating the average of 37.6% that have a “documented/structured” process with 44.1% and 41.0%, respectively.

In 2018, the percentage of Companies without a formal research approach is almost the same as in 2017 (38–39%). There is an increase in the percentage of those who created their own process and a decrease of those using borrowed process, including ResearchXL.
We see this as a positive sign that indicates an increasing level of commitment to CRO activities.
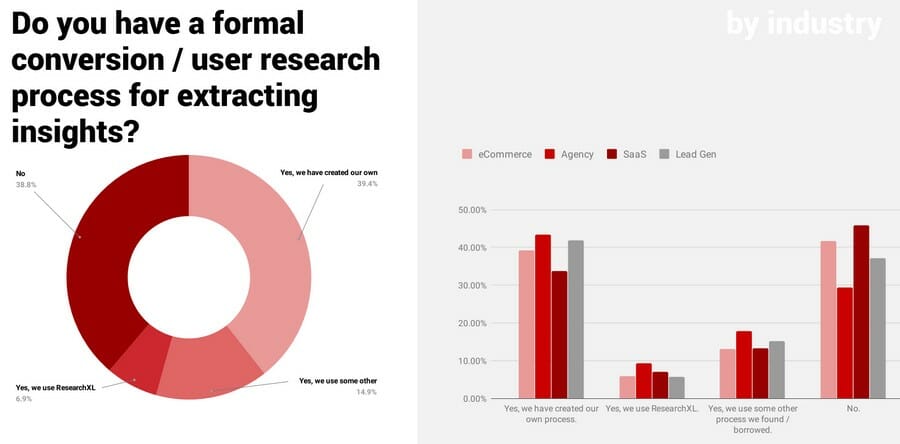
Among companies with their own research process (39.4%), Agencies/Freelancers (43.5%) and Lead Gen (41.9%) stand out. Ecommerce is on par with the average, and SaaS lags behind (33.7%).
Another important component of the overall CRO process is the system used for the prioritization of tests. While most companies use a test prioritization framework, 43.6% just wing it. Things are getting better—it was 47.1% in 2017.
Ecommerce companies and Agencies beat the average when it comes to investing in an “in-house” tool.
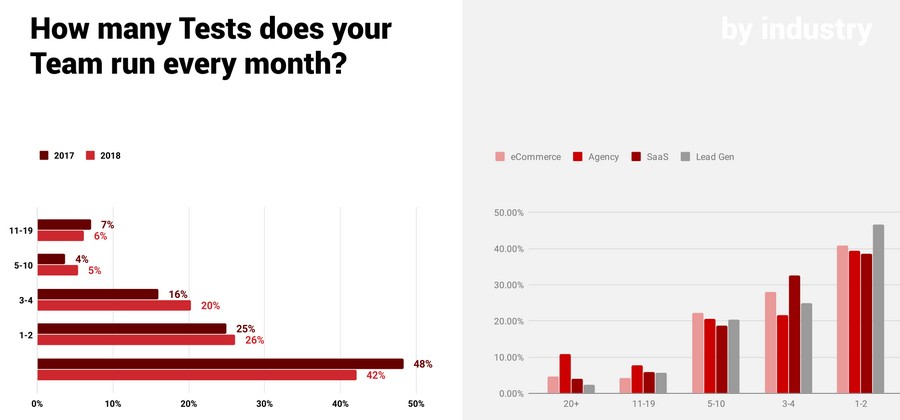
CRO execution
Most companies (68.2%) do not execute more than four tests per month. SaaS and Leag Gen companies are equally “slow” while Agencies are leading the way, with 39% executing more than four tests per month.
A slow rate of testing by in-house teams is one reason why companies outsource CRO work to agencies (like our own Speero agency).
Agencies live and die by the ROI they deliver to clients, motivating investments in better systems and teamwork, which return higher execution speed—and greater ROI (more on that below).
Tracking results and ROI
A good process should be self-improving; there should be procedures in place to learn from experience and modify the process as necessary. This is possible only if results are handled and evaluated properly and shared across the CRO team.
To get a good idea of what’s going on in the CRO Industry, we asked the following binary questions:
- Is the percentage of winning tests tracked?
- Is the average lift per test tracked?
- Are CRO test results shared across your team?
Lead Gen companies scored “Yes” most often, followed closely by Ecommerce organizations.
When we asked, “How are CRO test results typically archived?”, we found a gradual trend towards better results handling. Only 20.7% of respondents fail to archive results, an improvement from the 24.1% we measured in 2016.
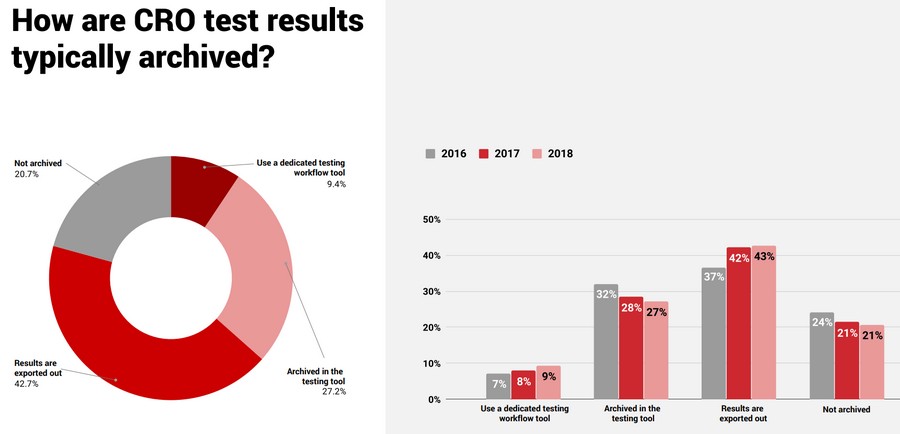
Most companies still export and archive full data with screenshots, but more than a third (a 36.6% cross-industry average) opt for specific archiving tools or testing tools with built-in archives.
Proving the ROI
As we learned from this survey, proving the ROI of CRO activities is one of the top six struggles of CROs. (You don’t have to guess the other struggles—just keep reading.) If your leadership doesn’t believe that conversion optimization will yield returns, that’s a big problem when you have to get buy-in.
Does CRO work?
In the survey, we asked participants to rate the results of their CRO efforts. Most respondents (56.4%) reported better results compared to the previous year, while 37% declared they achieved the same results.
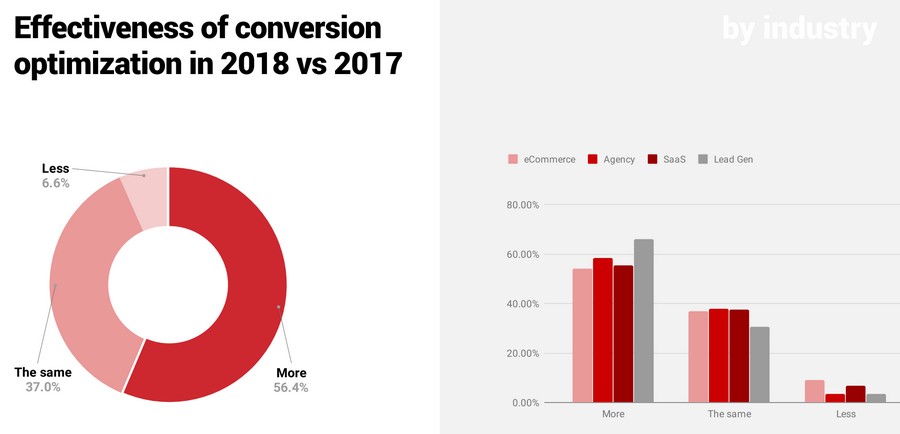
The Lead Gen industry stands out, with 65.9% achieving better results than in 2017. But of course, “better” results don’t necessarily mean “very profitable” results.
To understand the perception of the ROI within organizations, let’s see how they’ve changed their CRO budget and priorities in 2018. Some 60.8% report that, in their organizations, CRO activities are given more priority than in 2017.
Again, professionals in the LeadGen Industry paint the best picture, scoring 65.9%. (Same percentage, same industry: It seems that getting results pays off.)
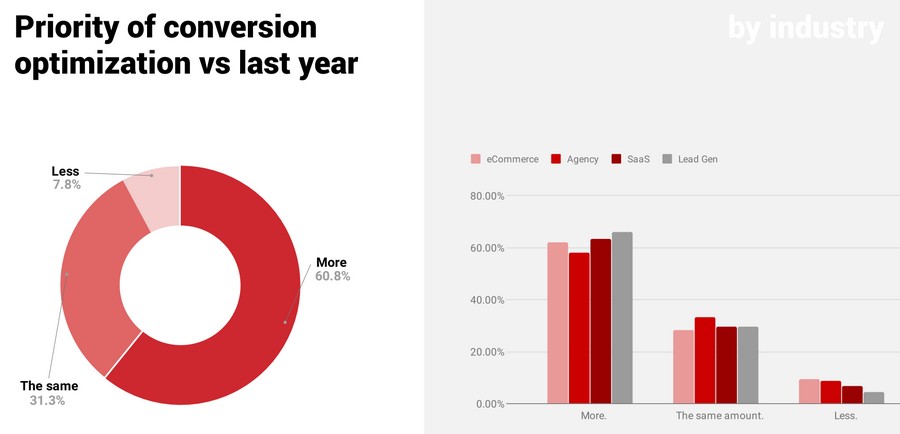
Only 7.8% of Companies are making CRO less of a priority in 2018.
But money is the final (and definitive) indicator of the effectiveness of conversion optimization, and only 45.0% of respondents report a bigger CRO budget than last year. Even in Lead Gen companies, a budget came in only 54.6% of cases.
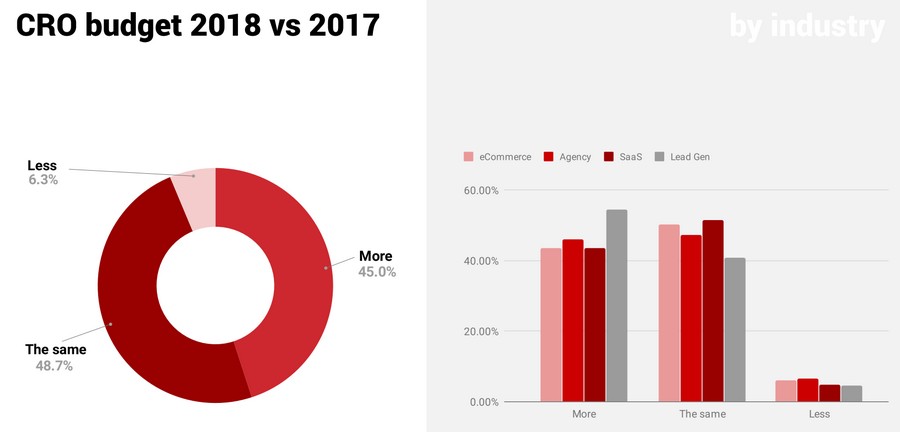
This means that, although the perceived effectiveness of conversion optimization has made it more of a priority, that effectiveness has not driven a majority of organizations to put more money into CRO.
In most cases (over 90%), CRO still does not have a dedicated budget but is part of the overall budget or marketing budget. However, in 2018, 57.9% of companies specifically mention CRO in the budget. (It was 53% in 2017.)

Trends in testing
Here it comes the fun part: tests!
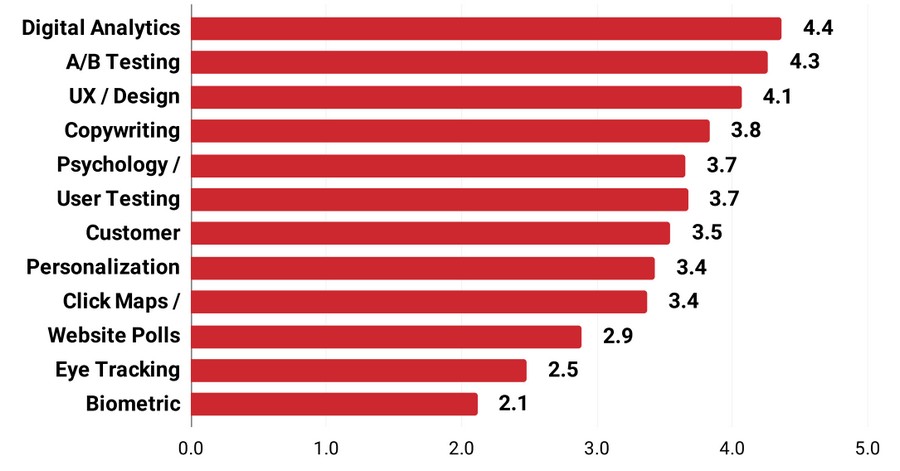
In the survey, we asked participants to rate the usefulness of different testing methods. Here is the list, ordered by the average score each method totaled:
- Digital Analytics
- A/B Testing
- UX/Design
- Copywriting
- Psychology/Persuasion
- User Testing
- Customer Surveys
- Personalization
- Click Maps/Scroll Maps/Mouse Hover Maps
- Website Polls
- Eye Tracking
- Biometric Research
The ranking is exactly the same as in 2017.
Some 97.6% of participants report running A/B/n tests, and 65.4% run exclusively A/B/n tests.
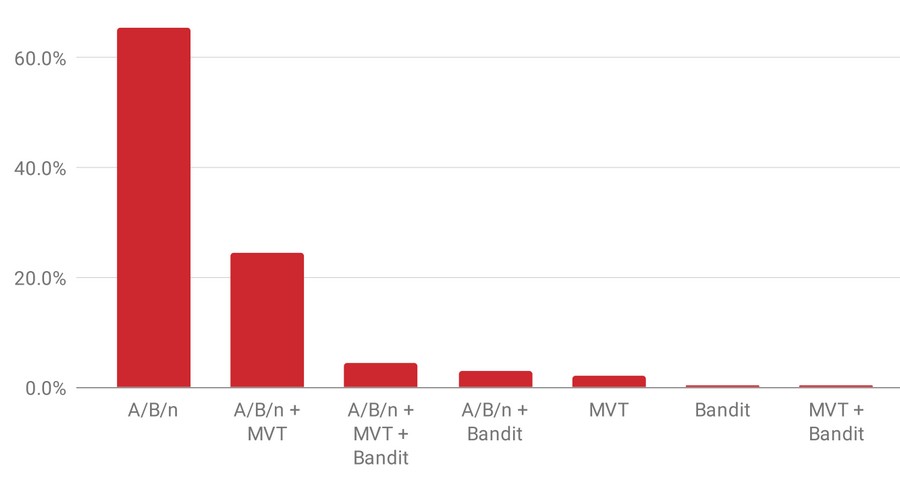
Compared to 2017, A/B/n increased in popularity; MVT is stable in the 31–32% range, although it has increased 25% increase compared to 2016.
Bandit tests are the least common, run by just 8.4% of our sample population.

Some 52.8% of CROs responding to our survey do not have a standardized stopping point for A/B testing—no change compared to 2017.
The biggest struggles
This year we asked an open-ended question: “In one sentence or phrase, what is your biggest CRO/Optimization challenge today?”
We collected 580 responses on this one, with a length ranging from 4 to 328 characters. (And, yes, the four-character answers were meaningful: “time.”) We analyzed each answer and identified 39 recurring topics.
After that, we created a scoring system based on the length of the answer (as suggested by Ryan Levesque in his book Ask), and we scored the topics. This method allowed us to sort topics (struggles) and assign a weight to the pain they cause.
According to this scoring system, 50% of the pain is caused by just six struggles:
- Establishing a process
- Learning/training
- Educating clients
- Proving ROI
- Time and budget constraints
- Integrating CRO into the business
Establish a sound process for CRO is by far the most common struggle—and the one that got the longest answers.
Almost all of the struggles mentioned above are internal struggles, meaning they arise not from external circumstances but from within the organization. This means that they can largely be fixed within the organization, too.
That brings us to the next batch of struggles, the ones that take our pain coverage from 50% to 80%:
- Getting management onboard
- Getting clients
- Wrong expectations
- Traffic
- Building a CRO team
- Client participation
- Technical skills
- Cooperation between development units
In this second batch, only two struggles are external: traffic and client participation. Everyone in the CRO space has experienced at least a few of the 14 struggles above. Curious about the other 15 struggles? Download the full report here.
Conclusion
Overall, there are largely positive changes compared to 2017, and we were able to dive deeper on how different industries are investing in CRO: Lead Gen has taken the lead, followed closely by Ecommerce and Agencies. SaaS still lags a bit behind, but not by far.
We are thrilled for what is coming in 2019 and we can’t wait to launch a new survey!
Wanna be in the 2019 Survey?
Over the three years that we’ve conducted this survey, we’ve noticed that CRO specialists tend to go by different job titles. This makes it hard to identify them correctly and to get in touch with them for a survey like this one.
Here are some job titles a CRO expert might go by:
- Analyst
- Conversion Optimizer
- Conversion Specialist/Consultant/Strategist
- CRO Specialist
- Director of Optimization
- Director of Marketing
- Ecommerce Manager
- Digital Marketing Analyst
- Growth Hacker / Head of Growth
- Digital Marketing Manager
- Growth Marketing Manager
- UX Analyst
- Product Manager
- Web Analyst
- And so many more…
If you are a CRO specialist and want to participate in the 2019 Survey, leave us your email in this form. We’ll get in touch with you when the time comes to collect new data.
Download the full report—with more charts and data—here.
Related Posts
-

In this 2017 State of the Conversion Optimization Report, we gave a 26 question survey…
-
In this 2016 State of Conversion Optimization Report, we gave a 48 question survey to…
-
You can divide SEO tactics into two general categories: the black hat and the white…
-

Learn how to run conversion optimization experiments the right way. In this video, I sit…