
Where should you start with your mobile app analytics?
If you’re launching a mobile app, you’ve likely considered the differences between optimizing a simple site and a mobile app or game. But have you considered how the measurement and data analysis process will be different?
Without a definitive plan and deep understanding of the fundamentals, your mobile app data will get complicated quickly. There are new tools, new terminology, new reports, new rules for efficiency, and so on.
So before you push that mobile app live, do yourself a favor…
Table of contents
Get to know the basics of app analytics
If you’ve just launched a mobile app, here are some questions you might be asking yourself:
- How many users have downloaded the app in total?
- How many of those users are active?
- How do users interact and engage with the app?
- What features do they use most often? Which do they ignore?
- Which channel generates the most users? Most valuable users?
- Are users experiencing an friction? Any technical issues? UX problems?
Tools you’ll be using
Fortunately, there are a number of tools that you can use to help you answer those questions. Here are just a few promotion and measurement tools…
- Google Ads: Advertise your app on Google search page results and on the Google Display Network (GDN). The GDN is made up of millions of websites, videos, and mobile apps.
- AdMob: Advertise your app in other apps. You can also allow ads in your app to generate additional revenue.
- Marketplaces: A marketplace is often the destination URL for your ads. It’s where a variety of paid and free apps are available for download. For example, the App Store or Google Play. These marketplaces give you key information about your users, like their referral source, which can help you make smarter marketing decisions.
Note that I’m recommending Google products since we’re using Google Analytics throughout this article, but there are many measurement alternatives, like Mixpanel or Localytics.
Choosing a revenue model and strategy for your app
First up? Choose a revenue model for your app:
- Paid app. This is a one-time fee to download the app. Alternatively, you can allow users to download the app for free and use a freemium model (i.e. upgrades and premium features require users pay a fee).
- In-app purchases. You sell goods/services to users after they download and begin using the app. For example, you sell coins in a game or users sell virtual products to other users. Of course, you can also sell physical products in-app.
- In-app ads. As mentioned, AdMob allows you to display ads (banners, full-screen displays, etc.) for other apps within your app. Every time your users click an ad in your app, you earn revenue.
Use data to determine which is best for you. In the end, it may be a combination of the three.

You’ll also need to decide your:
- Business objectives.
- Become the go-to video game retail store.
- Overall strategy.
- Create an mobile gaming app to promote the brand.
- Key performance indicators (KPIs).
- App revenue;
- 30-day active users;
- Find store location.
- User segments.
- Users from the United States;
- Users from Google Ads;
- Users who made a purchase in the last 30 days.
- Goals.
- 20% increase in 30-day active users by the end of Q3.
This will help you define conversions, set up goals, Events, and more later on.
Let’s take a popular mobile game, Clash Royale, as an example.
The developers can use Google Analytics goals to track when users collect a certain number of cards, upgrade a card, advance to a new level, etc. Those goals are logged and can be assigned values (e.g., a user reaching Level 3 is worth $25).
Now you need to actually collect data from your app via a software development kit (SDK), which connects to the Google Analytics APIs.
Getting started with Android apps
- Use the Android Studio to help with development.
- Use the Google Play Services SDK, which gives you access to all of Google’s services, including Google Analytics and Google Play.
- Create an AdMob account, which will also create Google Ads and AdSense accounts for you. Be sure to link your AdMob account to your Google Analytics account. (Learn how.)
- Make sure your AdMob account is linked to your app in any marketplaces it may be in.
- After you’ve linked Google Analytics successfully, you’ll see data in the “Analyze” tab of AdMob within 24 hours.
Getting started with iOS apps
- If you’re building for the App Store, ensure you have a Mac that’s running at least OS X 10.8 and Xcode, which includes the iOS DSK.
- You can also use the Google Analytics DSK for iOS on its own.
- Create an AdMob account, which will also create Google Ads and AdSense accounts for you. Be sure to link your AdMob account to your Google Analytics account. (Learn how.)
- Make sure your AdMob account is linked to your app in any marketplaces it may be in.
- After you’ve linked Google Analytics successfully, you’ll see data in the “Analyze” tab of AdMob within 24 hours.
Consider using Google Tag Manager, which will make it 10x easier to add/update tags for tracking. More on this later.
Acquisition and segmentation of mobile app data
When promoting your app, you have five main promotion channels…
- Search ads. Text ads that appear on search engine results pages based on the search term (i.e. Google Ads).
- Display ads. Banner ads that appear on websites, in videos, and within other apps. You can target an audience based on similar content or you can choose specific places to advertise. You can also use display ads for remarketing/retargeting.
- Social media. This one’s pretty self-explanatory. You can use social media to promote your app, either organically or paid. This works best when it’s built into your app. For example, allowing users to connect to Facebook, ask for lives from friends, announce achievements, etc.
- Email marketing. If you capture your users’ emails, you can use email marketing to retain and re-engage them (e.g., “You have one new friend request” or “You have a gold chest waiting for you”). Alternatively, you can advertise your app in third-party newsletters to reach an extended audience.
- Marketplaces. While you’ll often be driving third-party traffic to marketplaces, marketplaces are also designed to promote your app. It can be found via search, via popularity ratings, etc. This is why ratings and reviews can be so impactful.
App acquisition reports
Within AdMob, you can access Google Ads data within the “Analyze” tab. To start, let’s look at acquisition reports.

- Google Ads Reports
- Campaigns Report. Shows which campaigns drive the most revenue.
- Keywords Report. Shows which search keywords are most effective.
- Hour of Day Report. Shows when you receive the most traffic and when you receive the most valuable traffic.
- App Marketplace Report. Shows each of your marketplaces and how they compare. In the event you see “Not Set,” it’s likely that the marketplace does not support App Installer ID, which is used to identify the marketplace.
- Sources Reports. Show which traffic sources drive users to your marketplace listing, how long they stay, how much they spend, etc.
- Google Play Referral Flow Report. Shows how users move through the stages of your acquisition funnel. This will show where users fall off, which are high-value optimization points. Note: Often, people cannot get this report to function properly. Don’t forget to link Google Analytics to your Google Play Developer Console.
- New Users Report. Shows an overview of users that launched your app for the first time, including the total number of new users, operating systems, app versions, countries/territories, etc.
Defining high-value users for your app
You can use Google Analytics to do this. Look at the users who are generating the most revenue for you.
- Where are they coming from?
- Which features do they use?
- How frequently do they use the app?
Now look at your low-value users. What similarities do they share? What differences?
Once you figure this out, you can convert low-value users into high-value ones by encouraging the behaviors that result in high-value users. You can also ensure high-value users remain high-value users. Finally, you can double down on the marketing efforts that result in high-value users.
For full information on data segmentation and how to master it for yourself, read How to Setup Google Analytics and Segment Your Data. While the article is not expressly written for mobile apps, it’s just as applicable.
For the sake of simplicity, get started with “purchase” vs. “non-purchase” segments. How do the two compare?
This can help identify opportunities to increase conversions (e.g., X might be why non-purchasers are not converting, or there may be UX issues for users in French-Canadian areas) and make smarter promotion decisions (e.g., X demographic is more likely to convert, so let’s target them in ads).
You can dig much deeper, so don’t stop there.
How to track user behavior on your mobile app
Some behavioral questions you might have at this point:
- What behaviors do my users display?
- Are they experiencing glitches and crashes?
- How are they interacting with the app?
Behavioral reports
To answer those questions, let’s look at the behavioral reports:
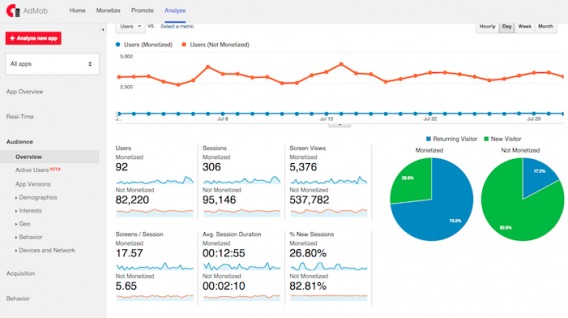
- Overview Report. Shows a summary of behavioral data: screen views, crashes, total events, average time on screen, etc.
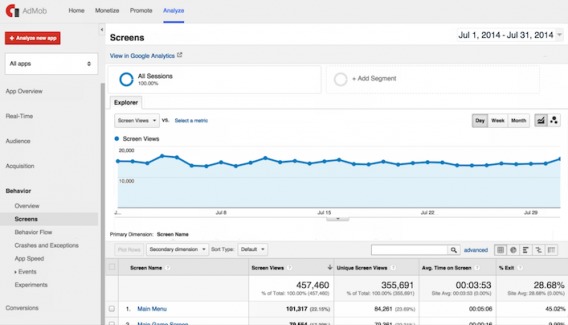
- Screens Report. Shows the performance of each screen within your app, including screen views, unique screen views, average time on screen, percent of users who exit on the screen, etc.
- Behavior Flow Report. Shows the different paths users take while using your app.
- Crashes and Exceptions Report. Shows the most popular exceptions within the different versions of your app. Note that crashes are automatically separated from exceptions. You can also define exceptions using your app-tracking code to get more data (e.g., device X and OS Y lead to “network failure” exceptions).
- App Speed User Timings Report. Shows how long requests take to load in-app. This report shows how long it takes for screens to load, how long it takes to return search results, how long it takes users to progress beyond level X/complete in-app tasks, how load times differ based on geographic location, etc.
- Top Events Report. Shows data on the most commonly triggered Events (e.g., downloads, clicking ads).
- Event Screens Report. Shows which screens users are on when they initiate Events.
Don’t forget that you can apply segments to your behavioral reports the same way you do with acquisition reports.
Screen tracking
Screen tracking allows you to analyze the various screens within your app. You’ll be able to see which screens are most popular, how long users stay on each screen, how often purchases are made from each screen, how users move from one screen to the next, and so on.
For best results, use multiple screens instead of displaying all of your interactive content within one.
Why? Because if you use a different screen for each level of the game or each section of your app, you can see how far users progress. You can also see where they drop off, which indicates the need for further inspection. There could be a technical issue, which is a low-hanging optimization fruit.
There could also be a UX issue. For example, if the percentage of users who exit via the in-app store is high, the prices might be too high or the value might be unclear.
Screen tracking could also indicate where you should place in-app ads. If users are spending a lot of time on and rarely exiting from a screen, it could be a good place for ads.
Event tracking
Now, it’s important to note that screen tracking only looks at the “container.” The interactive content within the screen/container can be measured only through Event tracking.
What is included under the Event tracking umbrella?
- Menu selections;
- Ad clicks;
- Video plays;
- Swipes;
- Button clicks;
- Purchases.
To track Events, ensure you have tracking set up within your account and then use four parameters on the elements you wish to track: category, action, label, and value.
(If you want to track multiple elements within a screen, you have to set up Event tracking separately for each of the elements.)
- Category. Organize Events into groups (e.g., social shares).
- Action. Describe the Event (e.g., Twitter).
- Label. Describe the Event further (optional).
- Value. Numerical variable (optional).
Name these parameters strategically. They’ll show up in the Events Report, which is mentioned above. If you don’t name them carefully, your data won’t display in a useful way.
Don’t try to track everything. Track only what’s truly important to you—only what can help you make smart optimization decisions.
You can set up segments based on event completion as well.
For example, segmenting “Users who clicked on offer X” from “Users who didn’t click on offer X” will show you how the offer influenced behavior. Did they spend more after clicking the offer? Did they stay longer? Remember, segments can be applied to all reports.
Custom dimensions and custom metrics
Google Analytics gives you plenty of pre-set dimensions and metrics to analyze. However, there may be some that are unique to your mobile app.
In that case, you can use custom dimensions (e.g., Screen Name) and custom metrics (e.g., Average Time on Screen) to track data that’s uniquely important to your app.
Using custom dimensions and metrics, you can track users by the highest level they’ve reached or how many in-game coins they collect, for example. This can be useful for behavior analysis and ultimately, engagement and retention.
To set this up, start by configuring each of your custom dimensions and metrics in the admin settings section of Google Analytics. Here are the values you’ll need to configure…
- Name of the custom dimension. This is how it will appear in reports.
- Scope of the custom dimension. This states the data the dimension will be applied to.
- Name of the custom metric. This is how it will appear in reports.
- Type of custom metric. Will it be a integer? A monetary value? A time?
- The minimum and maximum values for the custom metric.
Note that you need to ensure both custom dimensions and custom metrics are switched to active.
Why custom dimensions and custom metrics?
What can you do with custom dimensions and custom metrics? Two things, primarily. First, you can add them to custom reports. Second, you can build segments using them. Using these new segments, you can further drill down into your data and pull out insights.
For more information on custom reports and custom dimensions, I recommend you read How to Get Started with Google Tag Manager (Part 1).
Tracking and analyzing in-app purchase behavior
You can do this by enabling Enhanced Ecommerce. I won’t go into detail about how to set this up because Google does a better job of that I could. Click here to read about enabling Enhanced Ecommerce.
Once it’s enabled, you’ll get access to three core reports:
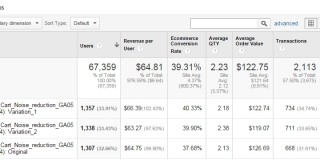
- Product Performance Report. Shows sales performance and buying behavior related to each product.
- Product List Performance Report. Shows how category pages and search results drive sales.
- Shopping Behavior and Checkout Behavior Reports. Shows you how users view products, abandon products in their carts, complete transactions, etc.
You’ll know how much revenue each in-app product generates, when people buy the same product multiple times, which products are falling flat and wasting real estate, and so on.
Why to use Google Tag Manager for your mobile app
In the past, we’ve written about why Google Tag Manager is so helpful and how to begin using it. For mobile apps, the benefits are even greater. Here’s how Google explains it:
Google Tag Manager enables developers to change configuration values in their mobile applications using the Google Tag Manager interface without having to rebuild and resubmit application binaries to app marketplaces.
This is useful for managing any configuration values or flags in your application that you may need to change in the future, including:
- Various UI settings and display strings;
- Sizes, locations, or types of ads served in your application;
- Game settings.
Configuration values may also be evaluated at runtime using rules, enabling dynamic configurations such as:
- Using screen size to determine ad banner size;
- Using language and location to configure UI elements.
Google Tag Manager also enables the dynamic implementation of tracking tags and pixels in applications. Developers can push important events into a data layer and decide later which tracking tags or pixels should be fired. Tag Manager currently supports the following tags:
- Google Mobile App Analytics;
- Custom Function Call tag.
Put simply, Google Tag Manager allows you to make basic changes without needing to push a new app update to marketplaces.
Why does that matter? Well, according to data from Kaitlin Marvin of Progressive Insurance and Scott Herman of Google Analytics at eMetrics Summit San Francisco, some 88–92% of users will update their mobile app in two weeks or not at all.
In other words, when you push a new version, if your users don’t update the app to that version within the first two weeks, they likely never will. You can see where pushing a multitude of updates to marketplaces can become risky.
A word of caution
But Google Tag Manager for mobile apps isn’t as simple as you might think. Sayf Sharif raises awareness of the common problems that arise from Google Tag Manager implementation:

Sayf Sharif, Seer Interactive:
“As I said initially, there are tons of benefits to using the GTM SDK in your mobile app, but you need to be aware of these common pitfalls, in order to head off problems before they occur.
1) Have a very in-depth measurement strategy and implementation plan prior to development.
2) Understand that the development of the GTM SDK in mobile might take a little longer than the GA SDK depending on your plan.
3) Prepare for the debugging process to be a little awkward.
4) Educate your marketers to properly tag all their campaigns so you get your correct referral information.
5) Be comfortable with not necessarily getting every single piece of data because of the dispatch process and the realities of mobile devices.
As long as you understand all that, and prepare for it, you’ll be ready for the additional power and insight that a proper implementation using the GTM SDK will bring. It’s totally worth it.” (via LunaMetrics)
If you’re ready, here are some implementation resources from Google to get you started:
Conclusion
Now that you know the fundamentals, you’re ready to launch your mobile app and make smart optimization decisions based on accurate, useful data.
The key word there, as Chris Mercer would say, is “useful.” If you don’t spend the time upfront to organize your data in a useful way, I guarantee you will regret it, especially if you’re optimizing a mobile app.
Related Posts
-

Update: Google has announced that Optimize and Optimize 360 will shut down on September 30,…
-
80% of people never leave home without their phones in hand. We do everything with it,…
-
In digital analytics, it’s all about asking the right questions. Sure, in the right context,…
-
A/B testing tools like Optimizely or VWO make testing easy, and that's about it. They're…


This is a good brief on mobile app analytics. Web applications are very common and people are getting use to it. However, this post covers a good basic on how to get a grip on mobile app analytics. Thanks for the post :)
Glad you got some value from the article, Sayed. Thanks for reading!
i am very long time struggle the Learning itself about APPs Marketing( ASO ). i am found great knowledgeable article , i am learn app analytic and reporting. thanks @Shanelle Mullin keep it up…
Thanks a lot, Rene. Let me know if you have any questions about the content!
Hi Shanelle,
thanks for that great article! Do you also have an recommendation which tool I should use to do A/B-Testing in apps? Is it better to have all testing in one place (e.g. like with Optimizely) or should I use app-specific tools like Taplytics?
Would be great to get an answer on that! Thanks!
Best,
Do
I personally find it easier to have all of my tests in one place, but as long as the tool you’re using is high quality and reliable, it’s really just a matter of personal preference.
Thanks a lot for reading, Do!