Data should speak for itself, but it doesn’t. After all, humans are involved, too – and we mess things up.
See, while data may be pure, humans are riddled with cognitive biases, dissonance, and egos. We hold positions that may be contingent on a certain way of working. Our ideas are fragile under the scrutiny of empiricism.
That’s why the hardest work in a/b testing doesn’t have anything to do with the statistics, the ideation, the research, or the implementation – it has to do with communication, politics, and in general, dealing with other human beings.
Fortunately, the HiPPO is not an insurmountable obstacle, and you can still get things done as an analyst that’s buried in the data or as an optimizer whose job it is to tell executives the bad news – that their ideas and strategies may be wrong.
Table of contents
When Your Career Depends On The Test Results…
I was listening to the Mine That Data podcast a few weeks ago when they were talking about communicating A/B test results. This is a common conundrum, as it turns out. As Kevin Hillstrom (founder of Mine That Data) told the story…

Kevin Hillstrom:
“A few weeks ago, I was going over the results of an A/B test with a client. The individual who had executed the test had a vested interested in making sure that ‘A’ was the winner.
See, this person’s incentive structure was based on A winning. This person had spent 20 years in his career making sure that he was an outstanding professional and had built an area of expertise. And his expertise required that A was going to be the winner of the test. He was the one who recommended A. He was the one that was brought into the company to do A. And so, we go over the results of the test, and it’s obvious that B is better than A.
And the professional starts doing the things you often hear when a test goes sideways. And mind you, this person set the test up. This person determined the sample sizes. This person determined the structure of the test. This person determined the length of the analysis of the test. And the results of the test were exactly the opposite of what happened.”
Essentially, the executive that recommended the test started making excuses. He began to rationalize things. “No, it couldn’t have been that B was better. The sample was polluted, and the data is biased.”
However, what the executive was exercising was cognitive dissonance.
It’s understandable of course. Dude’s job is on the line. What if his whole career – the expertise he’d build up, the ideas put forth – crumbled because of a silly test result?
Therein lies the conundrum of communicating A/B test results to executives.
Concede, and Then Flip The Question
An analyst with controversial test results wields a lot of power. As Hillstrom put it, “There are very few other people in the company that are able to demonstrate accountability the way you are able to demonstrate. So the people on the receiving end of your A/B test results are going to have a built in reason to be suspicious if your results are contrary to where their profession is headed.”
So what can you do? First – and this may be contrary to your instinct – is that you can concede the point.
“Alex, is it possible that you screwed up?”
When you hear a phrase like that, you know the person has a vested interest in making sure that the test shows a certain answer. So just fess up, say “yeah, that’s possible.”
But after you concede the point, it’s important to ask a follow up question. As Hillstrom recommends, flip the script…
“Is it worth considering what the ramifications are if I’m right?”
If you’ve ever taken a high school writing class, you’ll recognize what this is. It’s a staple in persuasive writing – a literary device known as a concession.
What you’re doing is acknowledging and addressing your opponent’s point, demonstrating empathy, and easing their defenses. It’s important not to trigger a backfire effect.
Hillstrom then recommends listening carefully to their answers. He says that’s where the truth comes out. That’s where you find the real reason people are so resistant to the results. He finds that it’s often because you’re proposing a change to how someone does their job.
Think About How The Recipient Will Benefit From Your Results
When you deliver test results, think about how they will benefit or hurt who you’re talking to. In other words, appeal to self-interest, at least a little bit.
This requires empathy and a bit of messiness, but it moves things forward.
Hillstrom gave a great example of an catalog executive who has decades of experience, is very successful, has a nice house, and has built his credibility upon his catalog expertise. However, if Hillstrom brought him math and results that showed catalogs not to be effective, he’d likely tune it out. that is, unless you can throw them a bone in their sphere of influence…

Kevin Hillstrom:
“When I share results, I have to share them in a way that provides a benefit for the recipient of the message.
So if I’m sharing the fact that a catalog doesn’t work with a catalog executive, I have to, first of all, give them an alternative, and I have to throw them a bone within their sphere of influence.
I have to show them that there’s a group of customers where they can keep doing what they love doing. And now with this new group of customers, we’re going to do something else, and in total the company’s going to be more profitable. And that executive’s going to get a bigger bonus and be more successful. And the executive gets to keep doing what the executive has always been doing, just on a different scale, a different level.
That message is better than, “you’re an old school cataloger, and your tactics don’t work, and you need to stop doing it immediately.” Going that route doesn’t get you far. Calibrate your message to what an executive needs to hear to feel good.”
Give them some way that they still look good. The worst thing that can happen is that the executive tunes you out.
We wrote an article awhile back that outlined the top character traits of conversion optimization people, but we may have left out the ability to deal with people. Especially the idea above, that of conceding a point and giving a way out, has nothing to do with analytical thinking and everything to do with compromise and empathy. It’s not as pure as you’d like to act. But it gets things done…
Unless you can somehow get people to take action on your analytical brilliance, of what good is your analytical brilliance?
— Kevin Hillstrom (@minethatdata) February 1, 2016
Remove Outliers
A point about the actual analysis: outliers can sometimes burn you.
Hillstrom explains why he will sometimes adjust outliers in tests…

Kevin Hillstrom:
“On average, what a customer spends is not normally distributed. If you have an average order value of $100, most of your customers are spending $70, $80, $90, or $100, and you have a small number of customers spending $200, $300, $800, $1600, and one customer spending $29,000. If you have 29,000 people in the test panel, and one person spends $29,000, that’s $1 per person in the test. That’s how much that one order skews things.”
So Hillstrom takes the top 5% or top 1% (depending on the business) of orders and changes the value (e.g. $29,000 to $800). As he says, “you are allowed to adjust outliers.”
Introduce Anonymity in Reporting
Not all backlash comes from a place of career insecurity. Some of it comes from good ol’ ego and dissonance.
While introducing competitive measures can increase the beta of ideas, tying opinions to results can be a disaster in reporting. Strong opinions can sway rooms, and the objective results can fade away with justifications and conformity (as Solomon Asch showed so long ago).
Solution? Introduce a measure of anonymity.
Here’s a suggestion from Andrew Anderson, Head of Optimization at Malwarebytes:

Andrew Anderson:
“Anonymity is usually far more about reporting the results. Take a poll and talk about the totality of the votes (not who voted for what). Take multiple inputs but only talk about the winner experience, not whose idea it was or who was wrong, etc”
Research backs this up. Richard Thaler and Cass Sunstein wrote in Nudge about social influence and conformity. They cited studies that show that when you introduce anonymity, conformity isn’t as prevalent.
“On the other hand, social scientists generally find less conformity, in the same circumstances as Asch’s experiments, when people are asked to give anonymous answers.
People become more likely to conform when they know that other people will see what they have to say. Sometimes people will go along with the group even when they think, or know, that everyone else has blundered.
Unanimous groups are able to provide the strongest nudges – even when the question is an easy one, and the people ought to know that everyone else is wrong.”
Lead With Insights
Instead of being preoccupied on winners and losers, lead with insights.
As Joanna Lord talked about in her CTA Conference 2015 speech, at Porch they put out a weekly newsletter on testing. In it, the first thing they mentioned was the insights of the tests. Everything else fell below that, winners and losers included.
As she said, this changed the whole conversation. It made things less conceptual, and it brought about more action.
Efficient Communication Within a Testing Culture
Not all companies will have such a reproachful response to test results. Some organizations have developed mature testing cultures and encourage experimentation and discovery. At these companies, it’s still important to communicate results well.
Processize Your Reporting
Just as you should have a process in place for your testing, you should have a process in place for your reporting. It creates consistency, and affords less variability in how different team members report or consume data.
There are so many ways to do this it could be an article on its own, but you’ll want to figure a few things out for yourself:
- What to include in your reports
- When to share
- How to share
- How to format
These things might even changed based on whom you’re giving the report. Optimizely’s knowledge base actually has an awesome resource on compartmentalizing and processizing your test reporting. In general, here are the things they recommend you put in your reports:
- Purpose: Provide a brief description of “why” you’re running this test, including your experiment hypothesis.
- Details: Include the number of variations, a brief description of the differences, the dates when the test was run, the total visitor count, and the visitor count by variation.
- Results: Be concrete. Provide the percentage lift or loss, compared to the original, conversion rates by variation, and the statistical significance or difference interval.
- Lessons Learned: This is your chance to share your interpretation of what the numbers mean, and key insights generated from the data. The most important part of results sharing is telling a story that influences the decisions your company makes and generating new questions for future testing.
- Revenue Impact: Whenever possible, quantify the value of a given percentage lift with year-over-year projected revenue impact.
Like I said, what/when/how you report results will depend on whether you’re communicating with your team, your organization, or your executive stakeholders. There are also different tools you can use for reporting. Optimizely has a few templates on their article, but you could also incorporate tools like Experiment Engine and Iridion to further simplify the process.
Visualize Results
Annemarie Klaassen and Ton Wesseling from Online Dialogue wrote a blog post for CXL a bit ago about visualizing test results to better explain to executives as well as their team.
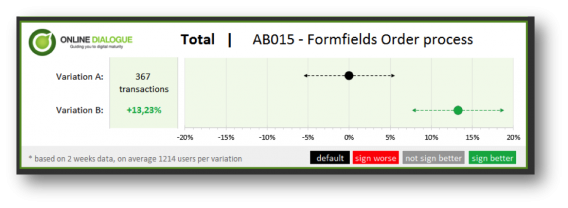
They outlined their whole process, going from simple Excel sheets to beautiful and clear visualizations. Here’s what they ended up with:
By visualizing test results like this, you can see the uplift and the expected impact right away. They added the number of test weeks and the average population per variation so the data analyst can feel confident with the results. Also, the analyst can easily explain to other team members or executives that, with a 90% certainty, the increase in conversion after implementation will be somewhere between 7.5% and 19%.
You don’t need to visualize things in the exact same way (though Online Dialogue does generously provide a template), but making things clear and visually persuasive help to keep everyone on the same page.
Conclusion
Communicating test results – dealing with the messiness of human nature – is actually the most complicated part of conversion optimization. It’s more nuanced, less predictable, and blocks more discovery than any other technical or organizational limitation.
Sometimes, you’ll be communicating results with executives that have a vested interest in a certain variation winning. In that case, it can help to concede a point. But then flip the script and frame the question in an organizational context – “What would the consequences be if the results are accurate?” How can we move forward if that’s the case?
Sometimes you need to assuage a fragile ego and throw someone a bone. Is there a segment where you can still get a lot of value from a losing variation? If it allows an executive to keep their livelihood – while increasing revenues for the company – it may be worth implementing.
Finally, even if you’re at a company that respects experimentation, it helps to processize your reporting. That way, everyone is on the same page and your analyses are open to less biases. When you can, anonymize ideas when reporting results, and implement a structure for when, how, and what to report.


There is another important matter here: Do not present just one A/B test. One test is just a lucky shot. With a good hypothesis you can create many tests based on that hypothesis. After a few tests you get the picture. After one test, you are doing just a lucky guess.
There is one thing to be fixed in the Online Dialogue’s excel template: the p-value in the table does not change when you select 1-tailed or 2-tailed.
Hi Renato, I looked into it, but it works fine on my computer. If you have a testvariation with more conversions than the default, then the p-value doesn’t change when you select either 1- or 2-tailed. The cut-off value only changes: with 1-tailed 90% significance, the variation is significantly better at a p-value of <0.1, with 2-taled 90% significance, the variation is better at a p-value of <0.05.
Only if you have a testvariation with less conversions than the default, then the p-value changes once you select 1- or 2-tailed. Let me know, if you still encounter problems. Thx!
That is a nice article, thank you!