
Your website is leaking money. Everybody’s is.
The first step toward plugging the leaks is identifying where the leaks are. Which funnel steps, which layers of your site, which specific pages are leaking money? Google Analytics can provide answers.
Table of contents
- 1: Funnel visualization
- 2. Conversions per browser (version)
- 3. Conversions and bounce rate per device
- 4. High traffic and high bounce/exit rate pages
- 5. High traffic, high bounce rate, low conversion rate landing pages
- 6. Screen resolution & conversion/bounce
- 7. High traffic, low speed pages
- 8. User flows
- 9. Conversions per traffic source
- 10. New vs. returning visitors
- Analytics tell you what happens, but it’s up to you to determine why
- Conclusion
1: Funnel visualization
Every site that has a funnel (most do) should start with funnel visualization. This Google Analytics report will tell you how much traffic is dropping off at each funnel step. For instance, here’s a three-step funnel (you’ll find this report in Conversions > Goals > Funnel Visualization):
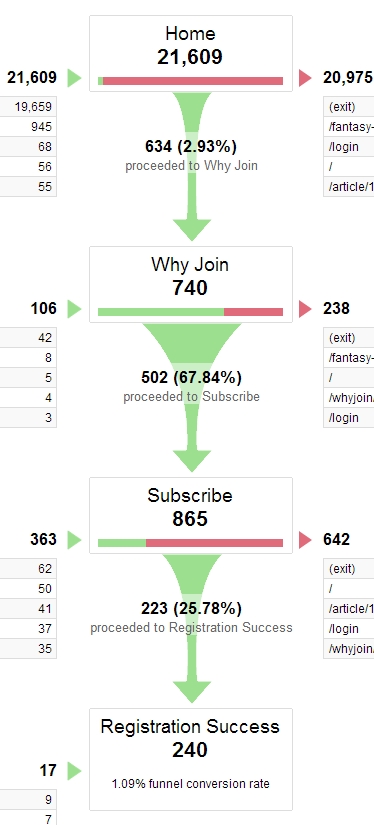
Where is the leak? Well, pretty much everywhere, but we see that the first step (home) converts only at 2.93%, so it has the biggest leak.
We’re losing huge amounts of absolute numbers there. However, this might actually not be the full picture. It’s also possible that the home page works great—makes a specific offer and lists the price, but 97% of the traffic is irrelevant/not interested/doesn’t have the budget, and so on.
Let’s assume that only ~3% of the traffic is qualified traffic, and the home page works great. It might very well be that the weakest link is actually the Subscribe page (25.78% conversion rate). People reached there after going through two steps—that should mean they are interested. A 25% conversion rate at a checkout / registration page is typically quite bad. So I might want to start the optimization effort there.
Beware of bad data: check it twice
Before you jump to conclusions, you need to be sure that your funnel data is correct. About half the funnel setups I come across are broken.
If you see stuff like this (numbers too good to be true), you know it’s bullshit:
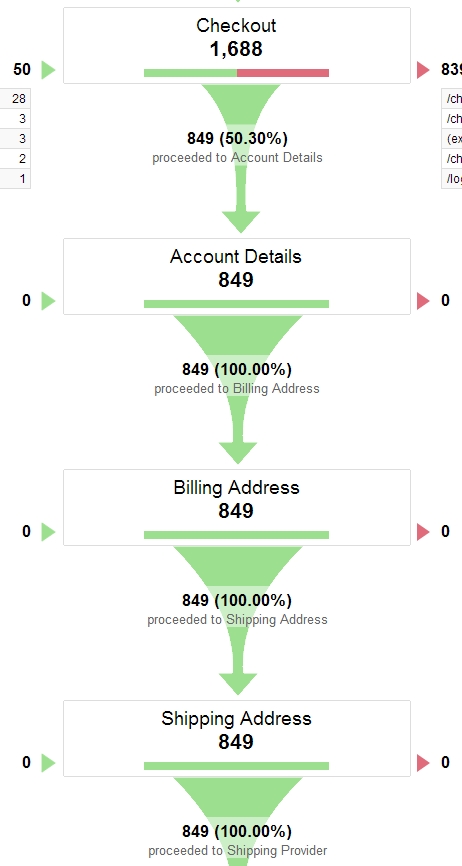
Nothing converts at 100% in this world. Nothing.
But that was an easy one. How about this funnel—can you see what’s wrong?
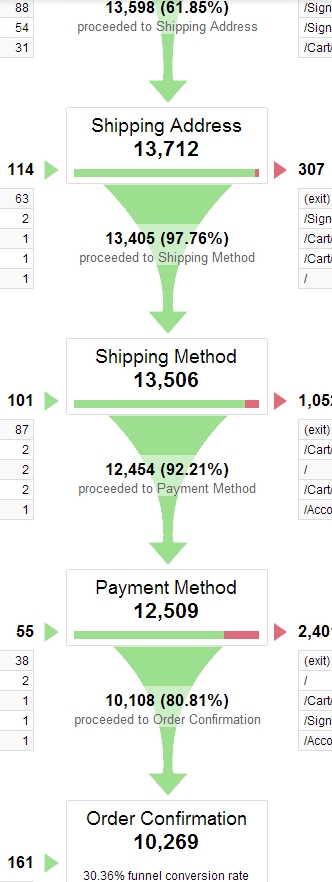
It was a trick question. You can’t see what’s wrong. The truth is that the funnel in Google Analytics was missing two steps!
When you go through the actual funnel, there’s also a ‘billing address’ step and a ‘review order’ step before completing the transaction. But you can only figure that out by actually going through the funnel manually and comparing URLs in the Google Analytics goal setup.
And just checking the URLs might even not suffice. You need to make sure the data is counted correctly for each step. How do you do that? By calculating the funnel manually.
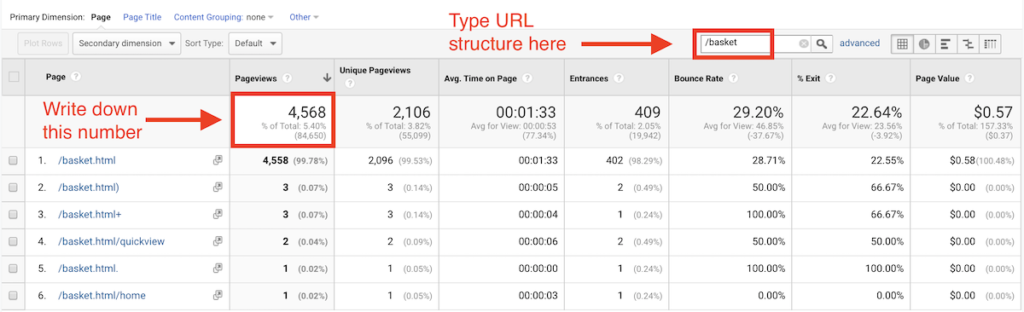
- Start with a manual walkthrough of the site, and map out the funnel URL structure. If the URL structure is not specific about the type of the page (e.g., /product/, /category/, etc.), I’ll make sure we’ll start track virtual pageviews for the same types of pages.
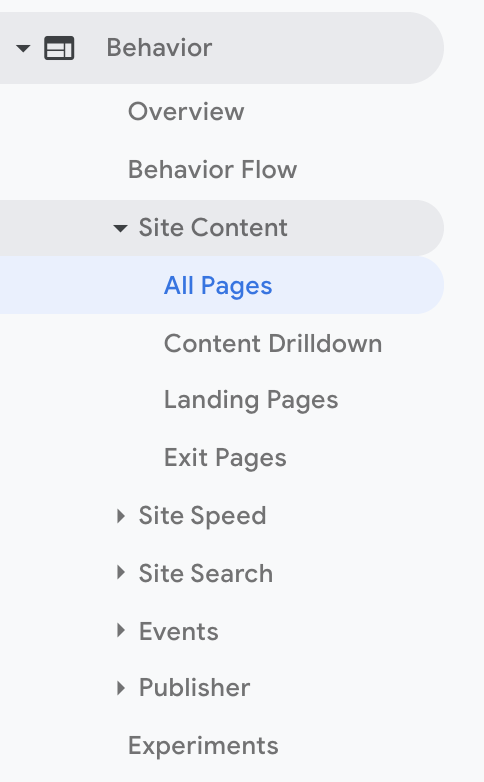
- I go to Behavior > Site Content > All Pages report, and type on the URL identifier of the layer, i.e. “/products/,” or “/cart/,” or “/checkout/step2/” or whatever they may be, and I count the unique pageviews per layer.
If you run an ecommerce site, the funnel steps might be something like this:
- Home;
- Category + Search;
- Product;
- Cart;
- Checkout step one (shipping);
- Checkout step two (billing);
- Checkout step three (review);
- Checkout completed.
So you’re using Behavior > Site Content > All Pages report to get unique pageviews for each of those layers. Once you have them, you need to check the numbers against what you see in Conversions > Goals > Funnel Visualization. If you see discrepancies, odds are that the Google Analytics funnel has been set up incorrectly.
What else might be wrong?
There are two or more funnels that merge into one. Like guest checkout vs. the first-time buyer who registers vs. the returning customer who logs in.
Some of the steps might be totally different. So you should either construct a separate funnel for each one to measure each journey separately, or otherwise make sure that your numbers are correct.
2. Conversions per browser (version)
You think your developers did a good job making your site work with every browser? Don’t count on it. One of the most common money leaks is incompatibility with some (even minor) browsers.
Take a look at your conversion rates per browser. Check each version differently, i.e. IE11 vs. IE10 vs. IE9, and so on. View this report in Audience > Technology > Browser & OS. Select browser version as your secondary dimension:
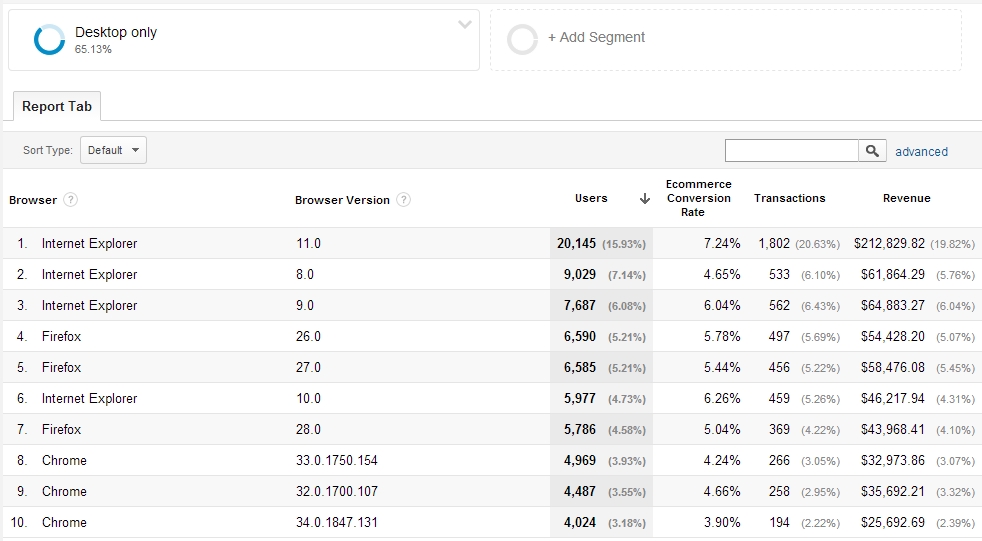
First things first: you need to look at these reports by device categories separately. So only desktop, only tablet, only mobile. No mixing, or you’ll get thrown off by wrong numbers. We need to compare apples to apples (the example above is desktop only).
So what can we learn from the above report? Internet Explorer 11.0 converts at 7.24% while version 8.0 is 4.65% and version 9.0 is 6.04%. Why?
Conversion rate of 7.24% vs. 4.65% is too big of a difference to be just about lifestyle. I would hypothesize that there are some bugs or UX issues that cause this. The only way to find out is to either conduct thorough testing of the site with IE 8, or to hire a quality assurance expert to test it for you.
You don’t need to have IE 8 installed on your computer—you can use BrowserStack or similar.
If you’re thinking “But why bother, no one uses IE 8 and other fringe browsers anyway,” let’s do the math. IE 8 at 4.65% conversion rate generated around $61,000 revenue during this time period.
Had it converted at 7% (still below IE11), the amount would have been around $77,000 (IE 8 traffic * conversion rate of 0.07 * average transaction size $122). Is $16,000 worth fixing some bugs? I would think so!
Note: beware of small sample sizes! Ignore any report that has less than 100 conversions per browser version. If you have a low volume site, just increase the time period you’re looking at.
3. Conversions and bounce rate per device
This is similar to the previous one, but device-specific. Are there any website rendering problems with specific devices like Samsung Galaxy S8 or Nexus 6? If so, you’re losing money. Low hanging fruits.
Start with conversions per device category (in Audience > Mobile > Overview):
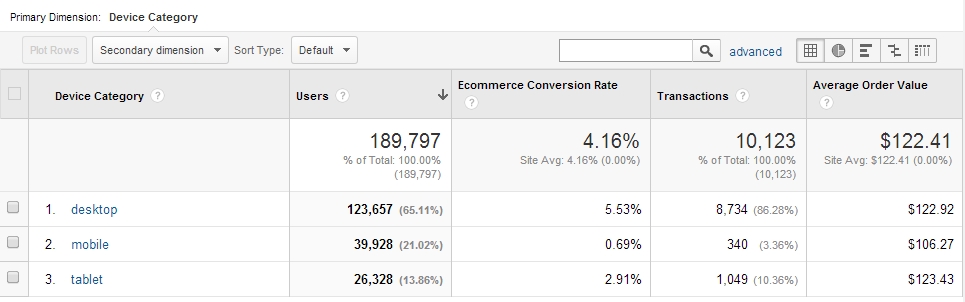
What you want to look at is the conversion rate discrepancy between devices. Broadly speaking, tablets should convert similar to desktops (maybe ~10% less), but mobiles convert on average at one third to one quarter of the rate of traditional or tablet devices. Total mobile sales are on the way up though.
Of course this can vary greatly depending on what you sell. Also, given that 98% of Americans switch between devices in the same day, there’s a strong chance that customers are visiting your website on their smartphone and then completing the transaction on a desktop or tablet.
Take a look at the total share of mobile traffic on your site (Audience > Mobile > Overview):
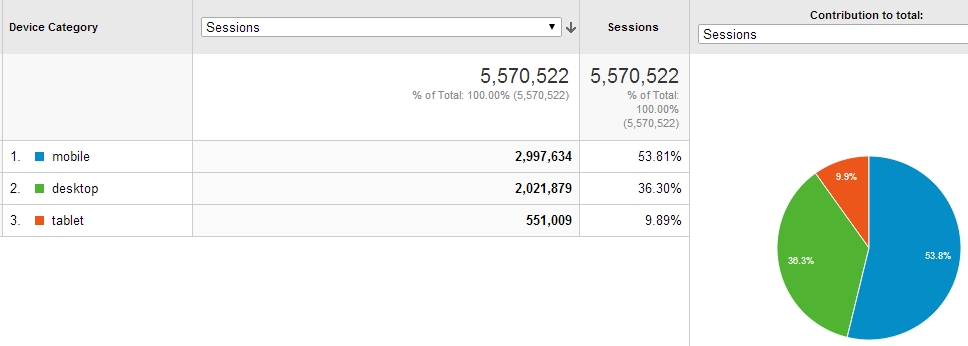
If desktop forms 50% or less, you need to take mobile traffic seriously. If your tablet conversions are not close to desktop conversions, you’re losing money. If mobile conversions are less than a third or even a fourth compared to desktop, you’re losing money
If your site is not mobile optimized (responsive design or dedicated mobile site), then start with that. You have an excellent business case now to present to your CEO. If you already have one, start exploring mobile and tablet conversions per operating system (select it as your primary dimension):
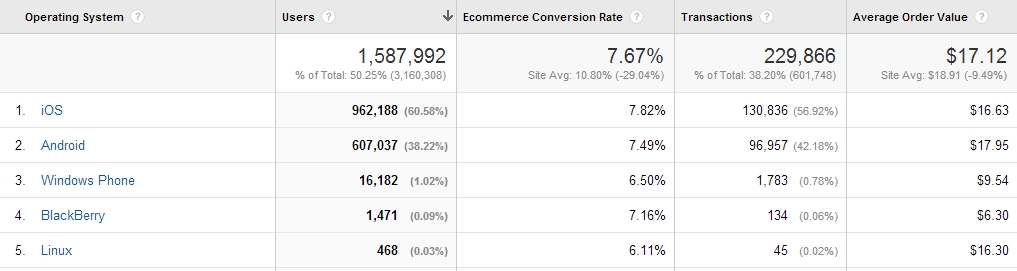
Sometimes you see huge differences here, and that tells you if the front-end developers neglected Android/iOS or some other operating system. This particular report seems to indicate that everything is (probably) fine.
What about specific devices? Let’s have a look at Android phones (note: this is an older screenshot which is why there are older models, but principles still apply today):
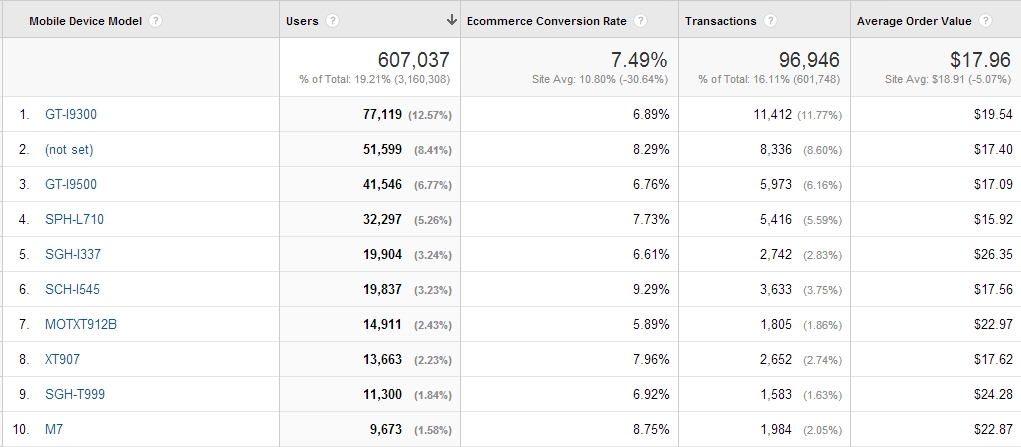
Device #5 (Galaxy S4) converts at high 9.29% while #7 (Droid Razr) converts at 5.89%. High-traffic #1 (Galaxy S3) converts at 6.89%. So now what?
It’s better to visualize it like this to understand the differences. Select this visualization from the top right corner above the flat table:
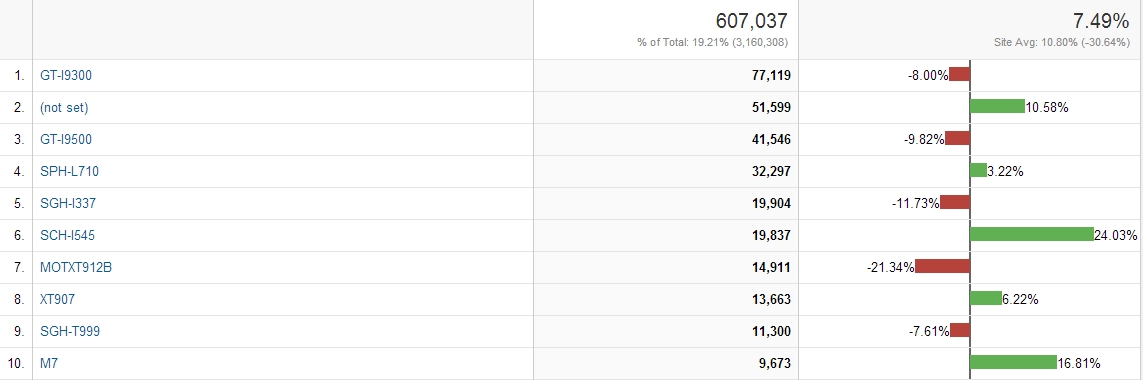
Now: do a quick calculation to figure out potential ROI if underperforming conversions rates were at current site average (7.49%) or higher. Once you know the potential gains, and it all looks good, move to quality assurance testing with devices that are in the red.
Note: of course, pay attention to trends and device release dates. Some underperforming devices are often safe to ignore as they’re not sold anymore.
4. High traffic and high bounce/exit rate pages
You work hard to drive traffic to your site. Where is that traffic going? And which pages turn them away?
Just look at Behavior > Site Content > All Pages.
Now, look at your top 25, 50, or 100 traffic pages. Which of them turn people away? Switch on the ‘comparison’ button, and compare the bounce rate as well as exit rate. Bounce rate is for people who arrive via external link (e.g., Google search), and exit rate is for people who come from an internal link.
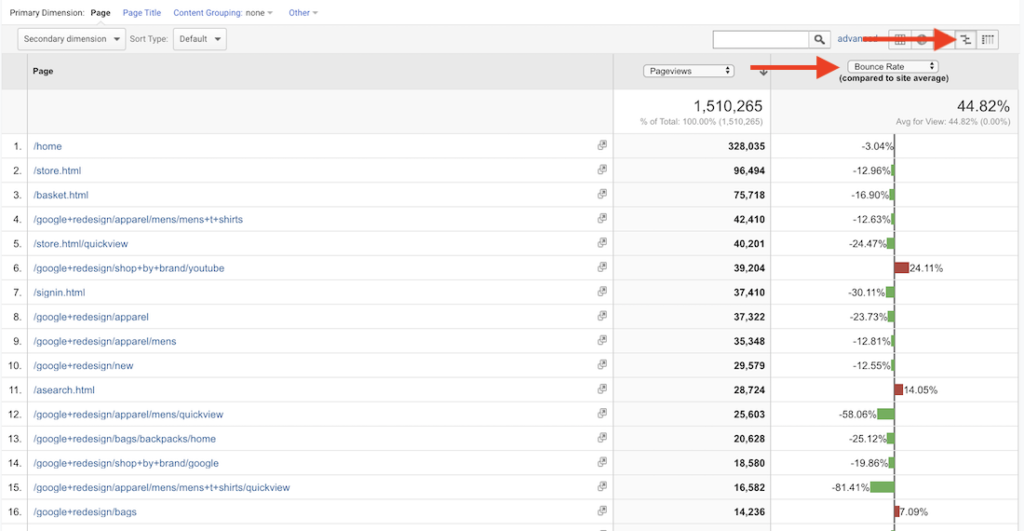
This is a nice, at-a-glance view to identify pages that are under-performing. Compare high-performing pages to low-performing ones, and see if you can spot any differences and elements you can improve.
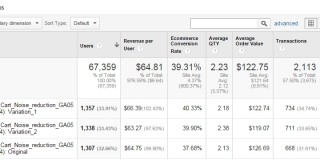
5. High traffic, high bounce rate, low conversion rate landing pages
Now look at just landing pages. If you drive paid traffic to your site, this is especially critical (look at paid traffic segment separately).
Which high-traffic landing pages have lousy bounce rate? This report is in Behavior > Site Content > Landing Pages.
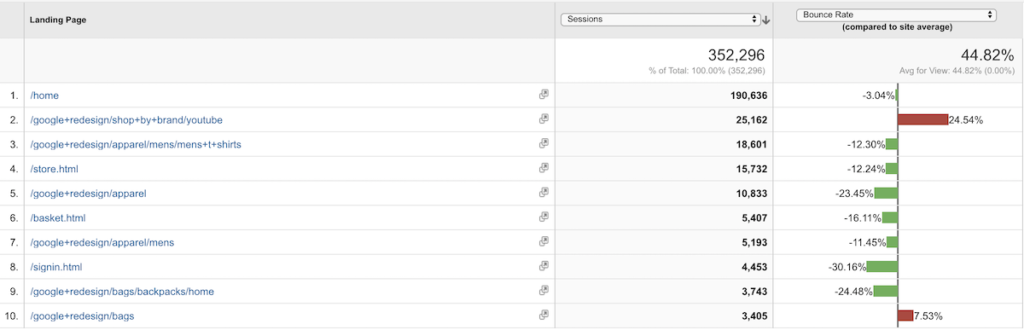
One you identify the low-performing pages, you can either figure out how to fix them, or alternatively try to stop sending traffic there (especially if it’s paid).
Now repeat the same report for ecommerce conversion rates and identify pages that result in lower than average conversions.
Once you can separate the top performers from sub-optimal ones, you can take action: either fix those pages, fix traffic sources, or stop sending traffic there (and send to high-performers instead).
6. Screen resolution & conversion/bounce
Different users have different devices—and different screen resolutions. Comparing bounce rate and conversion rate per screen resolution can give you hints about potential leaks.
Here’s an example in Audience > Technology > Browser & OS, with screen resolution as primary dimension:
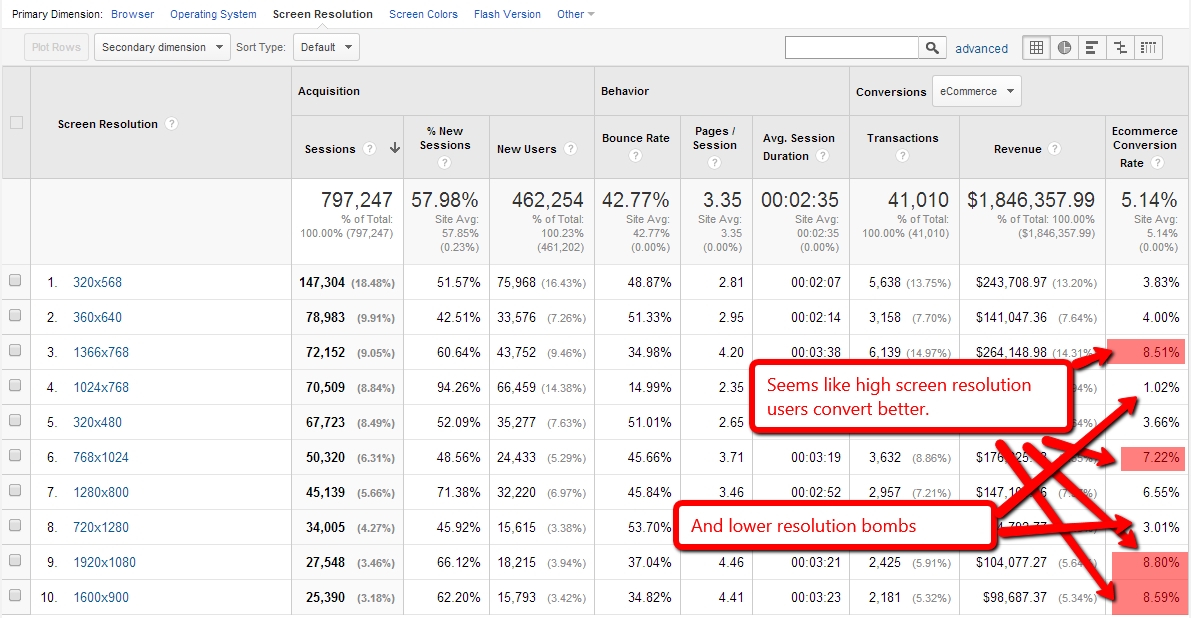
As always, data doesn’t tell you what to do. It’s your job to pull insights out of the data you see.
So it would appear that high resolution users convert better. Why is that? Could it be that they have more money? Perhaps. Or could it be that users with lower resolutions have poor user experience on your site? Highly possible. If so, fixing that is easy money again,
Pay attention to the screen resolutions with high bounce and/or low conversion rate. Identify them, then follow the rabbit down the hole and figure out what’s going on.
7. High traffic, low speed pages
Site speed matters a lot.
Hopefully you’ve fixed most of the stuff already, but pages don’t always cooperate. Some pages on your site are inevitably slower than other. Maybe even by a lot. Find out in Behavior > Site Speed > Page Timings:
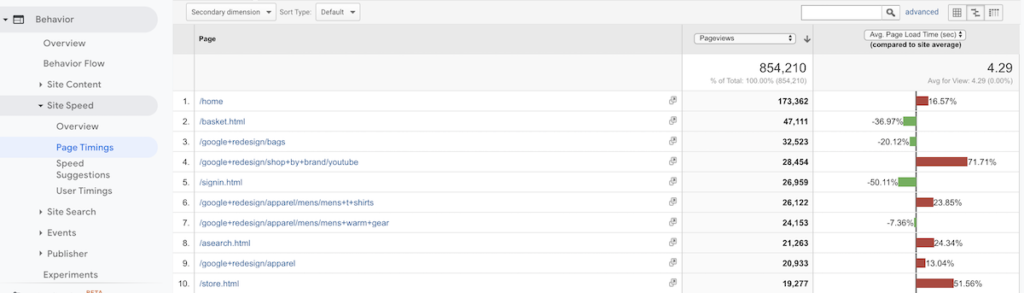
After identifying the high-traffic, low speed pages, time to run some reports on them via Google PageSpeed Insights:
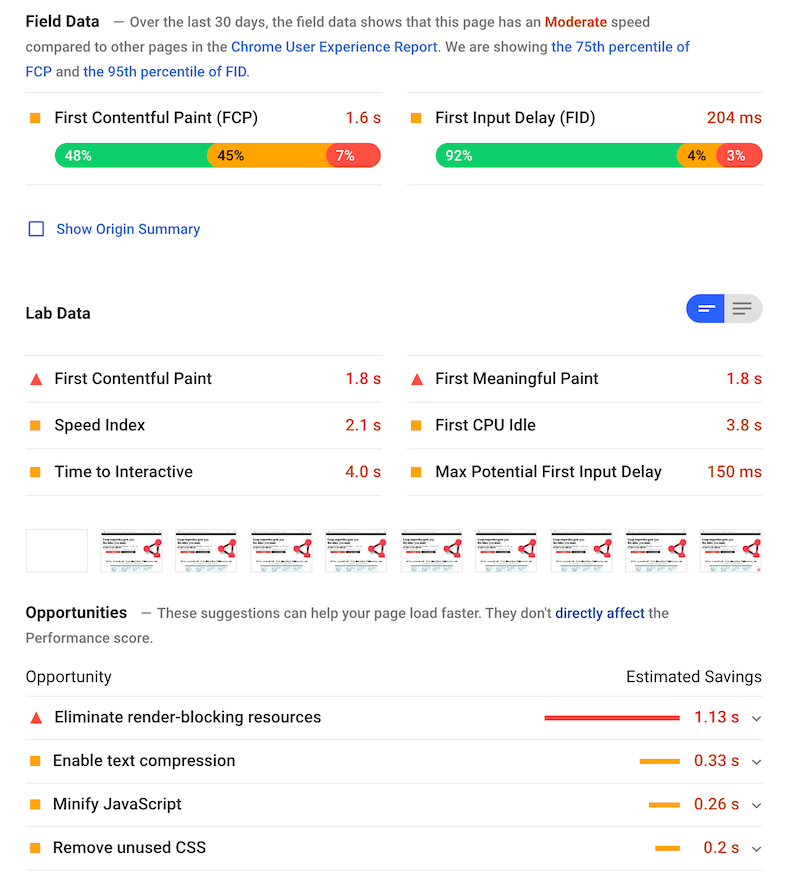
Next: (have your front-end people) fix all the issues reported here. Another set of leaks plugged.
8. User flows
User flows can be a gold mine. But it might not be obvious what to look for. The data is there, it’s up to you to find insights within the data.
So I was working on a website where you could either search for stuff on the home page, or browse for stuff (via ‘course directory’). User flow showed me this (in Behavior > Behavior Flow):

It looks like users can’t make up their mind. They went to the course directory, and back to the home page. And again. And again.
I found this behavior to be puzzling, so I set up two advanced segments: a) people who visit ‘course directory’ pages, and b) people who don’t. Then I looked at the conversion rate data for both:
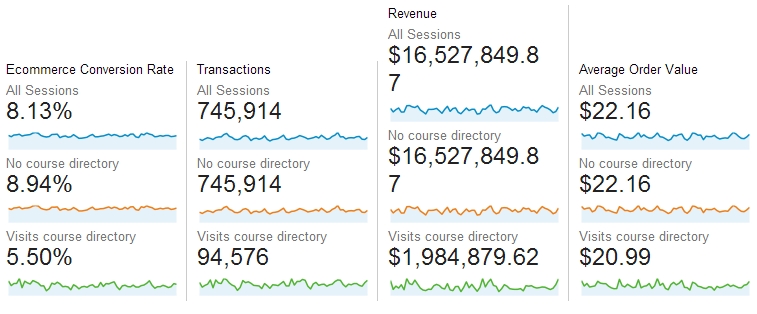
What do you know! People who wandered into course directory converted almost two times less. Ouch. Key learning: course directory pages leak money! So now I’d either have to fix them, or stop people from going there. I’ll better test both approaches.
So keep digging in your flow reports, and see what you can find.
9. Conversions per traffic source
Which traffic sources work, and which are a waste of time/effort/money? One of the easiest ways to improve conversions is to eliminate irrelevant, poor quality traffic, and to direct your marketing efforts toward channels that work.
Head to Acquisition > All Traffic > Channels:
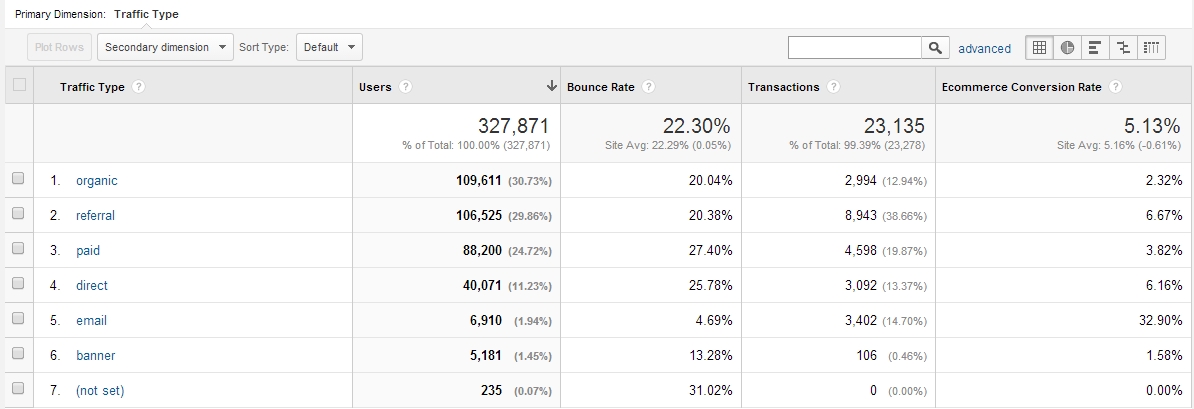
Email works! Gotta do more email. Banners not so much.
Next: go granular with specific sources.
10. New vs. returning visitors
Sometimes websites leak money because they try to sell new visitors too aggressively. How do you know? By looking at conversion rates per visitor type in Audience > Behavior > New vs Returning.
Sometimes you see something like this:
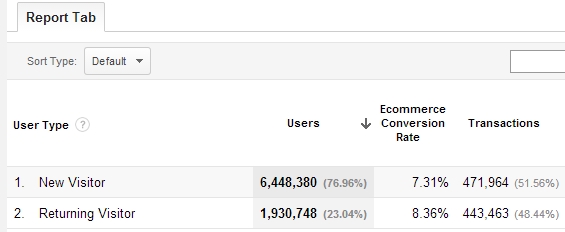
Not much difference between new and returning.
But sometimes it’s like this:
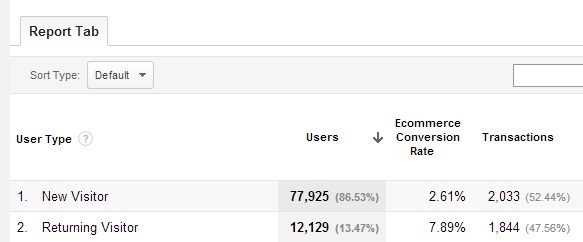
That’s three times higher! So now what? I’d run an experiment where we’d focus on email capture for new visitors, keeping in mind that we’ll make more money if they’ll come back. And then try to get them to come back via email.
By focusing on the sale too early, you might be scaring people away and thus causing money leaks.
Analytics tell you what happens, but it’s up to you to determine why
First step to plugging leaks is figuring out where the leaks are. Now you can combine heuristic analysis (experience-based assessment) with user testing and qualitative surveys to figure out the why.
Despite all the talk about data-driven marketing, it’s still mostly human-driven marketing. It is humans that have to make sense of the data, to draw insights from the data that you can then turn into test hypotheses.
But fixing the problems always starts with finding where the problems are.
Conclusion
Whenever you hear someone ask “what should I test first?,” you know you’re dealing with an amateur. They have a lot to learn. You can tell them that they should start by identifying where the leaks are.
Once you know that, you’re one huge step closer to coming up with split tests that might make a difference, and make more money.
Featured image by Thomas Saur, Tsamedien
Related Posts
-

A/B testing tools like Optimizely or VWO make testing easy, and that's about it. They're…
-
In digital analytics, it’s all about asking the right questions. Sure, in the right context,…
-
The success of an online business is measured by various indicators. The data required comes…
-
This post is not a dry feature-by-feature comparison, nor does it include a winner-take-all verdict.…


Great Stuff as usual. Send me the secret of your great blog posts, I love them.
Thanks Randy!
Hi,
Thank you very much for this post. It encouraged me to look closer into my funnel definition, which turned out to be set incorrectly for two years! :((( I looked deeper into very good e-book on GA just to found out that the type of URL match for the goal affected goal path as well! It was an eureka for me today! :)
Now finnaly I could draw funnel conclusions which make sense :)
Take care!
Irek
Familiar story!
Great post Peep, very informative, useful and practical insights!
As always Peep solid insights. I enjoyed seeing you on page fights yesterday too!
Thank-you very much for sharing your knowledge, it is much appreciated. Now I know what I will be doing this weekend. Funnels. LOL.
What a great article! So much information. Very useful. Thanks.
Was able to make a great point with #10 on an email campaign we’ve been struggling to get up for a client. Thank you!
One question Peep.
What sort of advanced segment did you use for the impact of course directory?
Hey just curious, I’m trying to set up a dashboard or just download a pre-made one that will show me the conversion rate by browser, and by desktop?
Natively the Audience > Technology > Browser & OS gets you really close because from there you can set the session to mobile only, tablet only, mobile and tablet, desktop and tablet, but I don’t see an option for just desktop??
Am I missing something?
Desktop only segment is not automated. You should set it up on your own. This is the link for this segment:
https://www.google.com/analytics/web/template?uid=E6Qoq9dyQUy6DSSUaaqkbg
Your funnel trick question isn’t that tricky. When a later step has more visitor than a previous step, you know something must be wrong.
Great article Peep, very comprehensive. To challenge the ‘nothing converts at 100%’ comment, the Google search box must go pretty close!
Hey Peep, awesome article with great actionable items! I had a question about #8. Did you by any chance test to see what the conversion percentages look like if you exclude visitors who directly landed on the course directory page?