
A/B testing tools like Optimizely or VWO make testing easy, and that’s about it. They’re tools to run tests, and not exactly designed for post-test analysis. Most testing tools have gotten better at it over the years, but still lack what you can do with Google Analytics – which is like everything.
When you run a test until you’ve reached validity (not the same as significance), you have to do post-test analysis to decide on the way forward.
Looking at a summary screen like this is not enough:
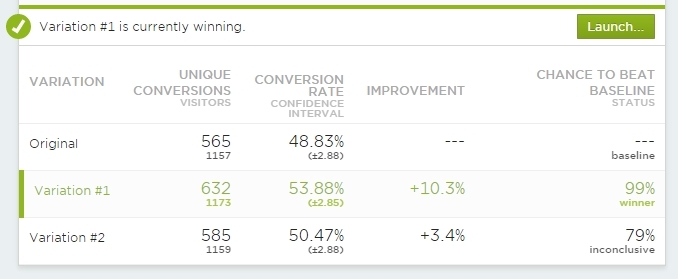
Use these at-a-glace views for a quick check to see what the overall status is. But you need to go beyond once the test is “cooked”.
Your test can really only end in 3 different ways:
- Control wins
- No difference
- Treatment(s) win(s)
Even when our testing tool tells us that that’s the final outcome, that’s not where our job ends. You need to conduct post-test analysis. And in most cases you need to do that OUTSIDE of the testing tool. Sure – Optimizely enables you to see the results across pre-defined segments, but that’s not enough either.
Table of contents
You need to integrate each test with Google Analytics
Both VWO and Optimizely come with built-in Google Analytics integrations, and data for each test should be sent to Google Analytics. It’s not only to enhance your analysis capabilities, but also to be more confident in the data. Your testing tool might be recording the data incorrectly, and if you have no other source for your test data, you can never be sure whether to trust it or not. Create multiple sources of data.
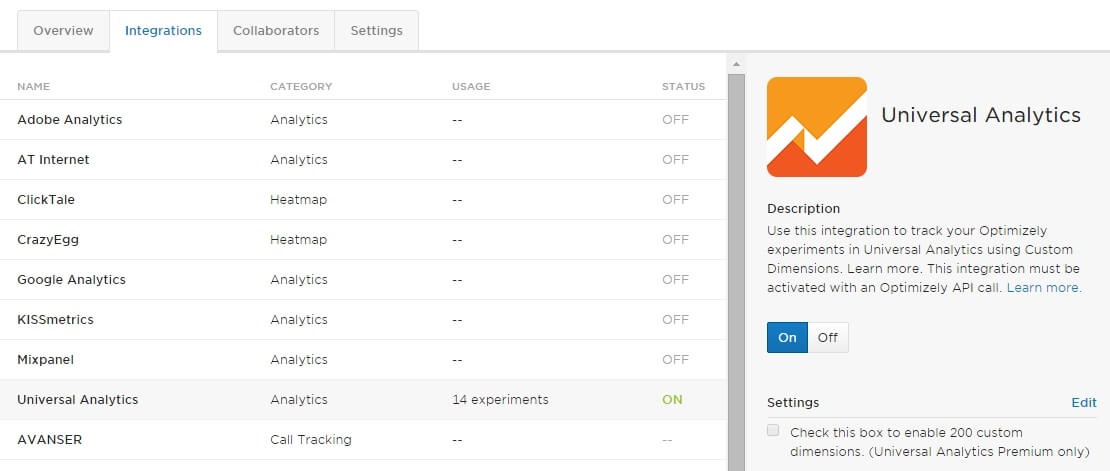
Optimizely Classic
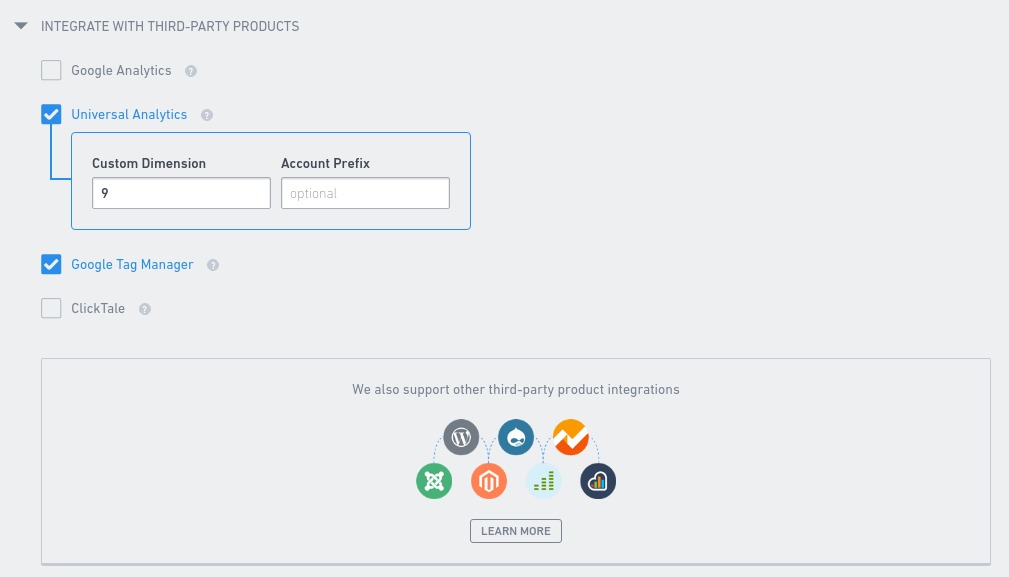
In Optimizely Classic setting up the integration is under Project Settings:
You definitely want to use Universal Analytics instead of Classic Google Analytics. If you haven’t switched your GA tracker over yet, do it as soon as you can.
Not only will you be able to take advantage of new GA features, you can have up to 20 concurrent A/B tests sending data to Google Analytics. With Classic it’s only 5.
And once this is done on a global level, you need to pick a slot for each test:
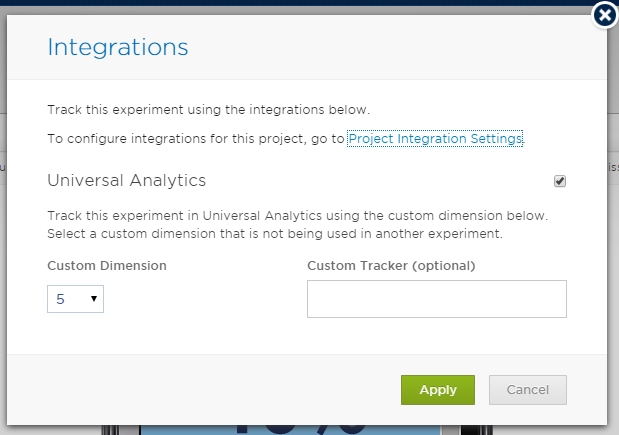
Make sure that there aren’t multiple tests that use the same Custom Dimension (or Custom Variable for Classic) slot in GA – they will overwrite each others data, and you can’t trust it anymore. One test per slot.
Optimizely’s manual has a step-by-step instruction for this integration as well, including how to set up custom dimensions.
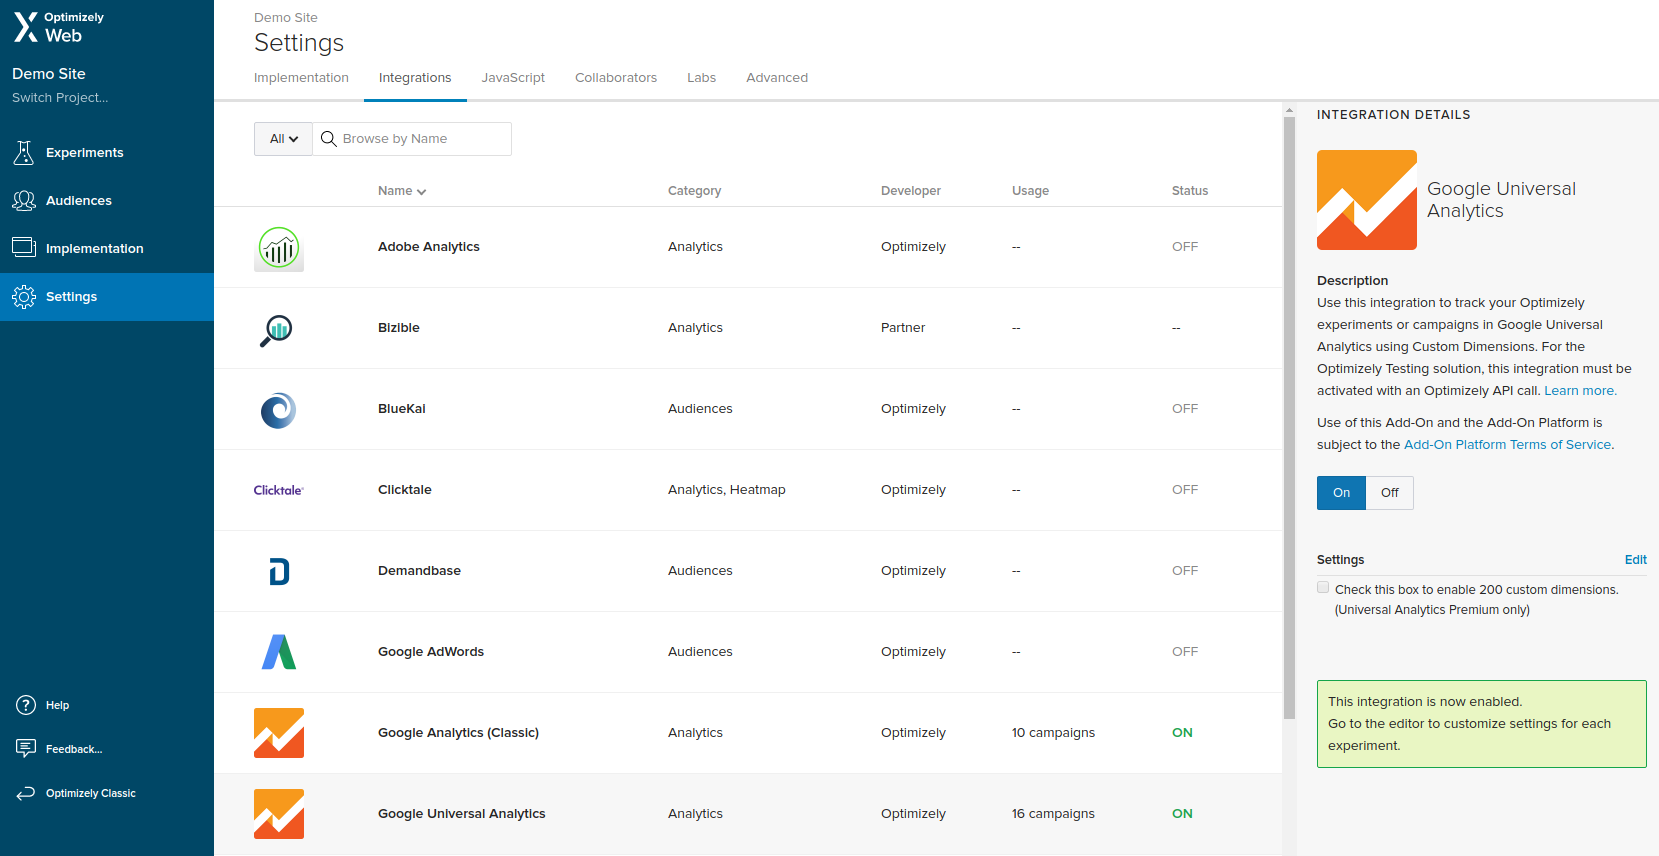
Optimizely X
In Optimizely X you have to go to Settings and navigate to Integrations, there you can find Google Universal Analytics, turn it on.
Once you have activated the integration on Project level, you also have to activate it for each experiment by picking the slot (Custom Dimension).
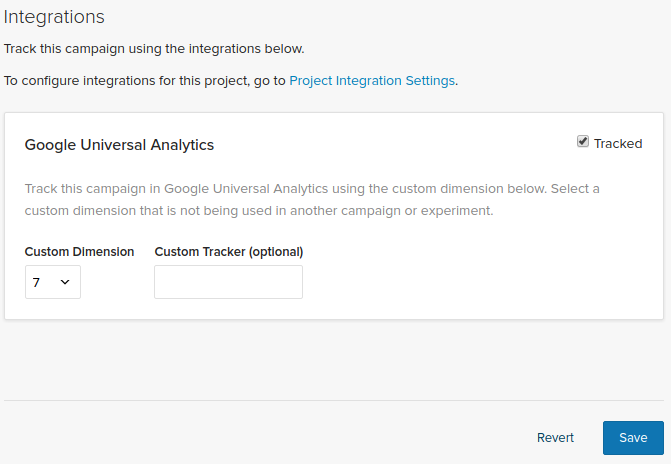
Just like with Optimizely Classic, you should never pick the same slot for two tests running at the same time.
For detailed information on how to get the integration running, including creating the Custom Dimensions in Google Analytics, take a look at the guide on their website.
VWO
When it comes to integrating Google Analytics with your VWO experiments, all you have to do is to pick the right Custom Dimension in the Others tab of Experiment Settings. This has to be done with every experiment.
As with Optimizely, one active experiment per Custom Dimension. Otherwise you risk overwriting some of the test data stored in Google Analytics.
More information on the integration is available in an article in VWO’s knowledge base.
Accessing experiment data in Google Analytics
Once done, you’re able to look at any test result in Google Analytics using Custom Reports. You can make the report show you ANY data you want:
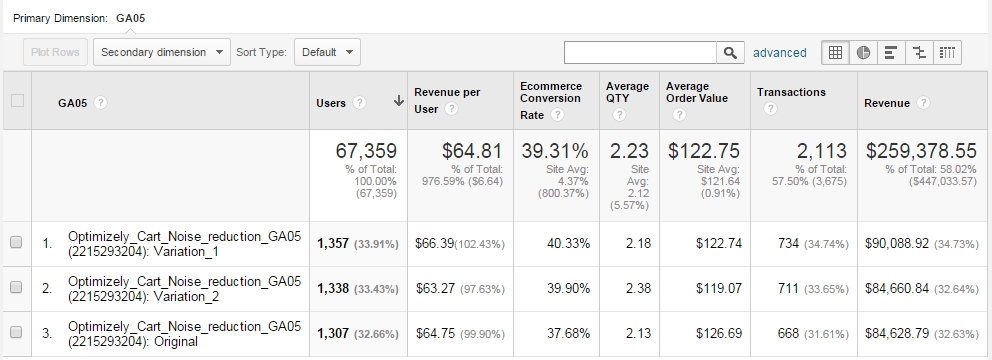
Some variation has more revenue per user? Why is that – well let’s look at average cart value or average quantity – those metrics can shed some light here.
Use whatever metrics that are useful in your particular case. Swipe the custom report used in the example here.
Note that Google Analytics won’t tell you anything about statistical significance (p-values), power levels, error margins and so on. You’d need to pull that data into an Excel / Google spreadsheet or something where you auto-calculate that. Don’t start the analysis in GA before the data is cooked. Make sure the needed sample size and significance + power levels are there.
Send variations as events to use advanced segments (audiences)
Built-in Google Analytics integration is not foolproof. Sometimes the data is not passed on, there’s a 20% to 50% discrepancy – somewhere somehow part of the data gets lost. There could be numerous reasons for that, anything from how the scripts are loaded, in which order to script timeouts and other issues. I’ve dealt with a lot of different problems over the years.
My good friend Ton Wesseling first told me about this workaround: send an event to Google Analytics each time a variation is loaded.
All you need to do is add one line to the test Global Javascript (executed for all variations), plus a line of event tracking code as the last line for each test variation.
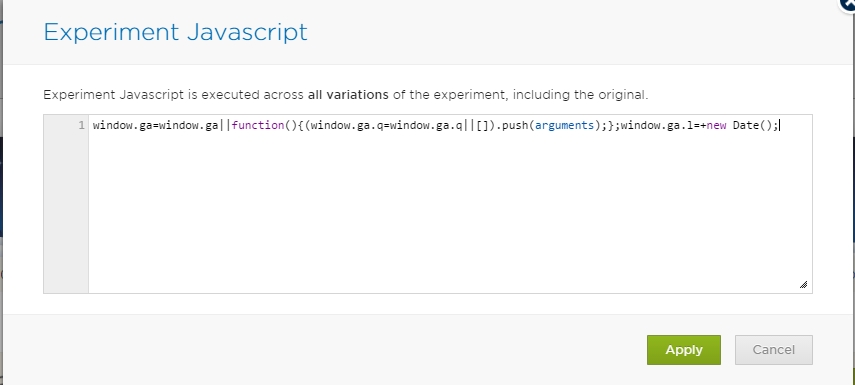
So this is the line you should add in the Global Experiment Javascript console:
window.ga=window.ga||function(){(window.ga.q=window.ga.q||[]).push(arguments);};window.ga.l=+new Date();
This makes sure that the GA tracker gets all the information once it loads.
Here’s where you do it in Optimizely. First open up the Settings while editing a test:
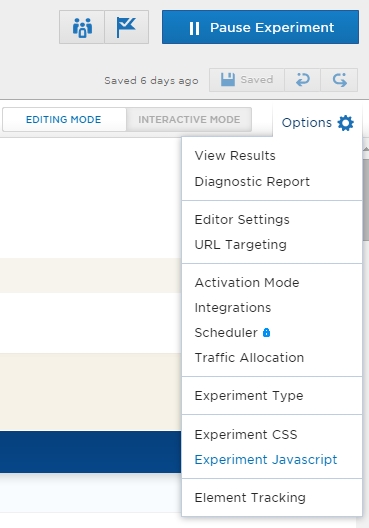
And now choose Experiment Javascript. Add the code there:
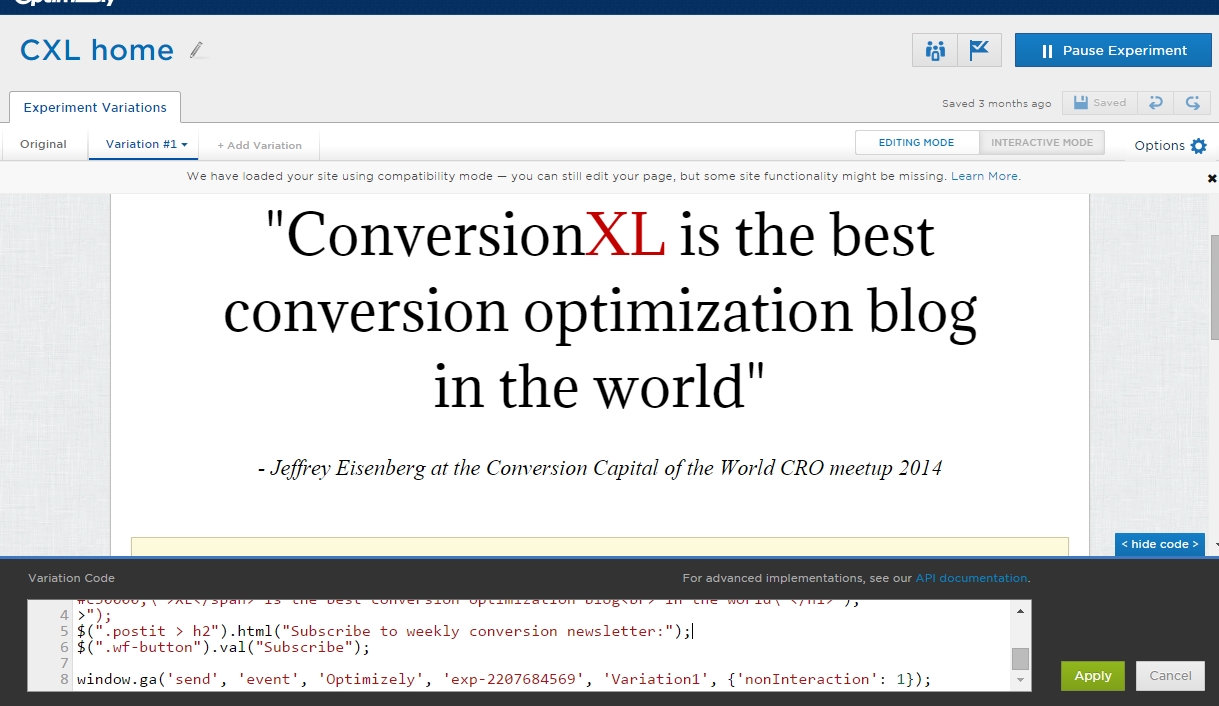
And now you need to add a line of event tracking code at the end of each variation (including Original). You need to just change the Experiment ID number and the name of the Variation:
window.ga('send', 'event', 'Optimizely', 'exp-2207684569', 'Variation1', {'nonInteraction': 1});
So what the code does is send an event to GA where the event category is Optimizely, action is Experiment ID (you can get that from your URL while editing a test) and label is Variation1 (can also be Original, Variation 2 etc). Non-interaction means that no engagement is recorded. Otherwise your bounce rate for experiment pages would be 0%.
Here’s where you add the code in Optimizely:
Now you’re able to create segments in Google Analytics for each of the variations.
Segment setup:
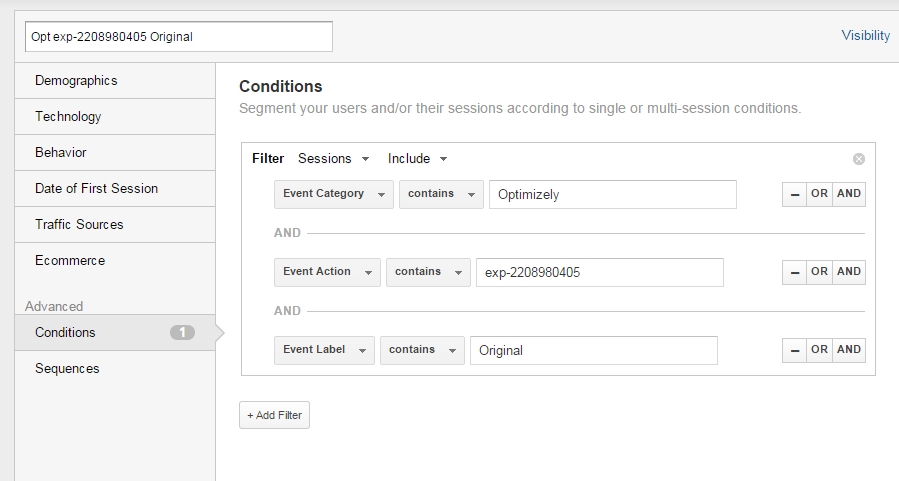
Create separate segments for each variation, and apply them onto any report that you want. So you could see something like this:
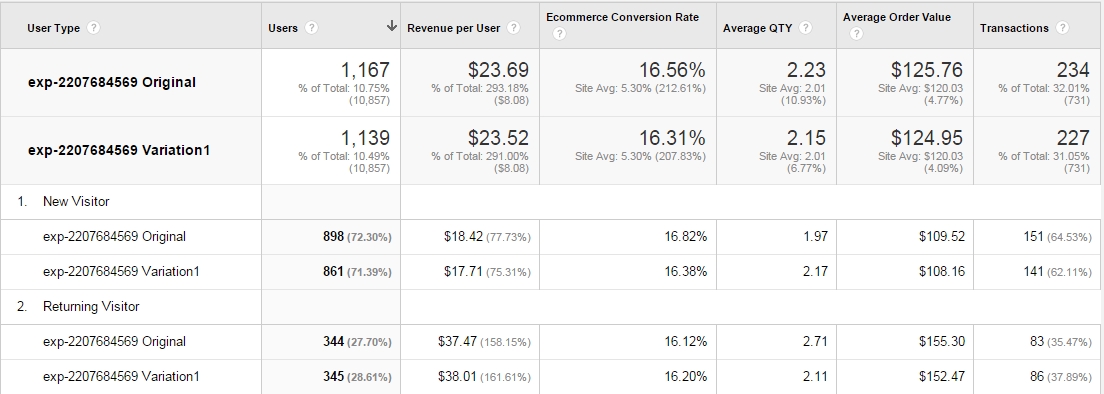
Illustrative data only.
Same thing can be of course done with Custom Dimensions. Just make sure data consistency is there – compare thank you page visits, revenue numbers etc between your Optimizely result panel and GA custom dimension or event based report”.
No difference between test variations. Now what?
Let’s say the overall outcome is ‘no significant difference’ between variations. Move on to something else? Not so fast. Keep these 2 things in mind:
1. Your test hypothesis might have been right, but the implementation sucked
Let’s say your qualitative research says that concern about security is an issue. How many ways do we have to beef up the perception of security? Unlimited.
You might be on to something – just the way you did something sucked. If you have data that supports your hypothesis, try a few more iterations.
2. Just because there was no difference overall, the treatment might have beat control in a segment or two.
If you got a lift in returning visitors and mobile visitors, but a drop for new visitors and desktop users – those segments might cancel each other out, and it seems like it’s a case of “no difference”. Analyze your test across key segments to see this.
Look at the test results at least across these segments (make sure each segment has adequate sample size):
- Desktop vs Tablet/Mobile
- New vs Returning
- Traffic that lands directly on the page you’re testing vs came via internal link
If your treatment performed well for a specific segment, it’s time to consider a personalized approach for that particular segment.
There’s no difference, but you like B better than A
We’re human beings, and we have personal preferences. So if your test says that there’s no significant difference between variations, but you like B better – there’s really no reason for not going with B.
If B is a usability improvement or represents your brand image better, go for it. But those are not good reasons to go with B if B performs worse in a test.
Conclusion
Don’t rely on a single source of data, and go deeper with your analysis than just looking at overall outcomes. You’ll find more wins and have better data to make decisions. Integrating your testing tool with Google Analytics is an excellent way to go about it.
(This post was significantly updated September 2017)
Related Posts
-

In digital analytics, it’s all about asking the right questions. Sure, in the right context,…
-
The success of an online business is measured by various indicators. The data required comes…
-
This post is not a dry feature-by-feature comparison, nor does it include a winner-take-all verdict.…
-
Over the last years, Google Data Studio has evolved from an appealing but clunky application…


Wow, I cannot believe you give this out for free. I had to read this 10 times to wrap my head around it. Very well done – thank you!
Haha, I agree with Adam. This is so incredibly helpful as we’re trying to build a CRO team at our company. There’s SO many things to consider and it’s so great to be able to come here and read “shortcuts” to avoid sucking as much.
Thanks, Peep!
Thanks guys!
As always, great article Peep. I was excited to see your final point when there is no difference. If there is no difference, then you can realistically use either two variations – it comes down to preference. You don’t hear enough people talk about this.
Granted we should be trying to improve pages, not make changes for the sake of making changes.
Thanks! Yeah, sometimes you can use your personal opinions too :)
Justin, in a related note, check out this – http://blog.analytics-toolkit.com/2017/case-non-inferiority-designs-ab-testing/
Awesome. Thanks.
Here is what we use to get a different view of our data:
VWO + this greasemonkey script http://www.goodui.org/vwoaddon/
Or sometimes we’ll plug our numbers into http://www.thumbtack.com/labs/abba for a better view of significance.
Would it work the same way with another a/b testing suite eg VWO?
Pretty much, just VWO interface is different.
I’ve always used custom variables through VWO (built in functionality if you just tick the box) to get the variation info into GA – there aren’t any restrictions that way as far as I’m aware as each test has its own test number appended to it, which I can then dig down into the detail. I’ve always used it to help understand, exactly as Peep explains.
Yeah – you just have to compare the numbers in VWO and Google Analytics to see if there’s any data loss. And you CAN NOT have more than 1 test per slot, or they will overwrite each other’s data (that’s a GA thing).
Great article, Peep!
It’s really helpful.
But as I know, there is one service for a/b testing – Changeagain.me .
As i know they have very close integration with Google Analytics (don’t know all the technical details how they do it). But due to this close integration you have all the data in one place and you can be confident in accuracy of this information.
Do you hear about this service?
There is actually another approach which is fast and more bullet proof. This will avoid to paste a line in every experiment variation, just one chunk of code in the experiment global javascript panel.
/* _optimizely_evaluate=force */

setTimeout(function() {

  experimentId = ;

  if (typeof(optimizely) != "undefined" && optimizely.variationMap.hasOwnProperty(experimentId)) {

    window._gaq = window._gaq || [];

    _gaq.push(['_setAccount', '']);

    _gaq.push(['_trackEvent', 'Optimizely', optimizely.data.experiments[experimentId].name, optimizely.variationNamesMap[experimentId], 1, true]);

  }

}, 1000);

/* _optimizely_evaluate=safe */
I didn’t test it yet, and I can’t guarantee what will happen with GA asynchronously loaded from the bottom of the page.
Hi Andrea
Yep this looks sensible indeed. I’m assuming var experimentId = value got lost because you used < and > and WP is interpreting it as an HTML tag?
Do you have an original source and any further discussion on that snippet you can point me to?
I guess we’re talking about http://tim.webanalyticsdemystified.com/?m=201210
Thanks for the mention Peep – we measure A/B-tests in events to be sure we are in control and not using some sort of blackbox AND not using custom dimensions / vars and so on keeps you unattached from others using the system. The only max is that there are only 500 events available to measure in one GA session.
Good add on from Andrea to use the global javascript, which can be done with Optimizely, it’s only not working for Universal Analytics. I also always load on document ready, so I know for sure that the visitor loaded the full page. Yes I’m missing some people, but better missing them than including people in the test that not fully loaded the page :-)
This is the UA code to use in Optimizely:
jQuery(document).ready(function() {

var experimentID = optimizely.data.state.activeExperiments[0];

if(typeof optimizely.data.experiments[experimentID] !== 'undefined') {

var experimentName = optimizely.data.experiments[experimentID].name; }

var variationName = optimizely.data.state.variationNamesMap[experimentID];

ga('create', 'UA-SOMETHING-SOMETHING', 'auto');

ga('send', 'event', 'AB-test', experimentName, variationName, {'nonInteraction': 1});
});
I can vouch for this version of the code! Ton gave it to me yesterday and I implemented it on a few experiments right away. So far it looks like it’s working perfectly. Very simple and easy way to get out of the black box ;-) It’s also much easier than doing the standard Optimizely/GA integration.
– Michael
Hi Ton,
Thank you for posting this! I tried using this code but Optimizely said the last “experimentName” was Out of Bounds and wouldn’t let me use it.
Am I doing something wrong? Do I have to replace any of the text in this snippet besides the UA property ID?
Thanks,
Alex
Do you have any tips on how to cope with sampling in Google Analytics? Basically 100% of our tests are affected by it and in my experience there is no point in drawing conclusions from sampled data in GA. In case of an A/B test we’d end up with a sample of a sample.
We tried exporting the data by chunks of shorter periods and adding it up, but I am not sure if that is the correct way to do it, since some visitors might be calculated twice (they visit repeatedly), so the number of visitors would be higher.
Thanks.
Hey Marek – I am afraid there’s nothing you can do to prevent sampled data when you have a highly trafficked site. We had the same issue and decided to send all web data to Splunk (big data tool) so it’s possible to work with the raw data.
Hi!
Is there a way to use this when running a split test in Optimizely. The code put in the variation code doesn’t work (probably because the redirect happens before the code is loaded.)