
That it costs five to seven times more to acquire a customer than it does to retain one isn’t entirely true.
The origins of this myth can be traced back to the 1980s when the Technical Assistance Research Project published research that stated the cost of customer acquisition was significantly higher when compared to the cost of customer retention.
Soon after the research was published, other institutions like the Customer Service Institute, Consumer Connections Corp., and ITEM Group all “found” similar data.
Truth is, it was mostly propaganda designed to sell high-level executives new customer loyalty programs. If you don’t believe me, try to find a single linked source that supports the five to seven times claim.
I bring this up because time and time again, I see business owners reallocating budgets based on soundbite statistics and ending up with disastrous results. If you want to see your business grow, analyzing your own data is essential for establishing viable benchmarks and goals.
In this article, I’d like to help you understand the different metrics associated with customer lifetime value (LTV), and explore how we can use this information to make more informed, data-driven decisions as it relates to how we budget our marketing spend.
Even if you feel like you’ve got this nailed, keep reading, because there’s some very surprising research that I’m sure you’ll find useful.
Table of contents
- What is Customer Lifetime Value (CLV)?
- How to calculate Customer Lifetime Value
- Why determining your customer lifetime value (LTV) is so important
- Determining your customer acquisition costs (CAC)
- Calculating your customer retention rate
- Calculating your churn
- Calculating a more accurate customer lifetime value
- A hypothetical scenario: Starbucks
- The effects of increasing customer lifetime value (micro case studies)
- Conclusion
- Bonus: Six quick tips to improve customer lifetime value
What is Customer Lifetime Value (CLV)?
Customer Lifetime Value (CLV) is the measurement of the total amount a customer will receive from an average customer during their lifetime, for as long as they are a customer.
This value is commonly known as CLV: for example, if your average customer value is $250 and on average they’re a customer for two years, your CLV will be $500.
How to calculate Customer Lifetime Value
Customer Lifetime Value (CLV) can be calculated by multiplying the average customer value (the average amount a customer spends) times the average customer lifespan. In turn, CLV = (Customer Value * Average Customer Lifespan).
Why determining your customer lifetime value (LTV) is so important
Before we get into the math, let’s talk about why figuring all of this out is so important.
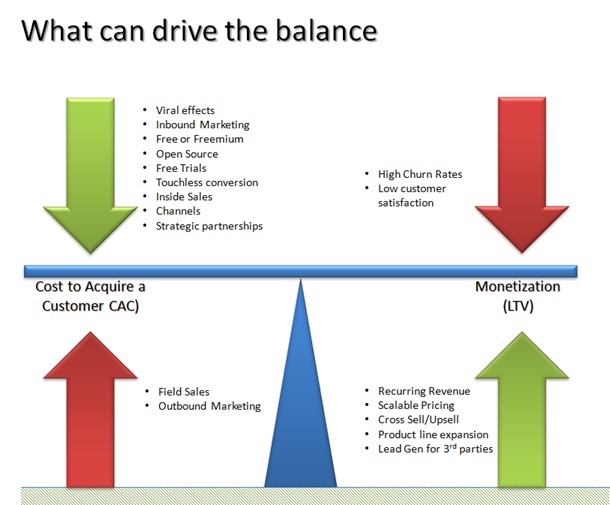
In this must-read article by venture capitalist David Skok, he says that the biggest reason startups die is because their customer acquisition costs versus their customer lifetime value often look like this:
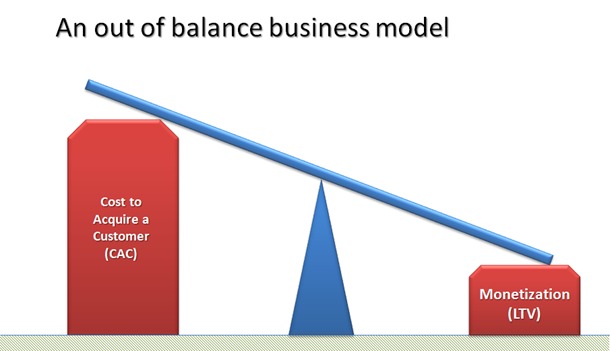
From my experience, that’s because so many businesses focus on transactional customer value, and forget to invest in the experience that happens after the conversion.
It should go without saying that you need to invest in making the product better. But if we’re not also focusing on ways to make our existing customers happy and even marketing to people who already bought from us, the cost of acquisition can greatly outweigh how much we can make from a single customer.
In David Skok’s post, he says:
Lifetime value (LTV) > cost of acquisition (CAC). (It appears that LTV should be about 3 x CAC for a viable SaaS or other form of recurring revenue model. Most of the public companies like Salesforce, ConstantContact, etc. have multiples that are more like 5 x CAC.)
CAC should be recovered in under 12 months (for subscription businesses).
In other words, if it costs you $400 to acquire a customer you should have a plan to make $400 off of that customer within the next year to have a healthy cash flow. (This rule is less important for companies with access to lots of capital.)
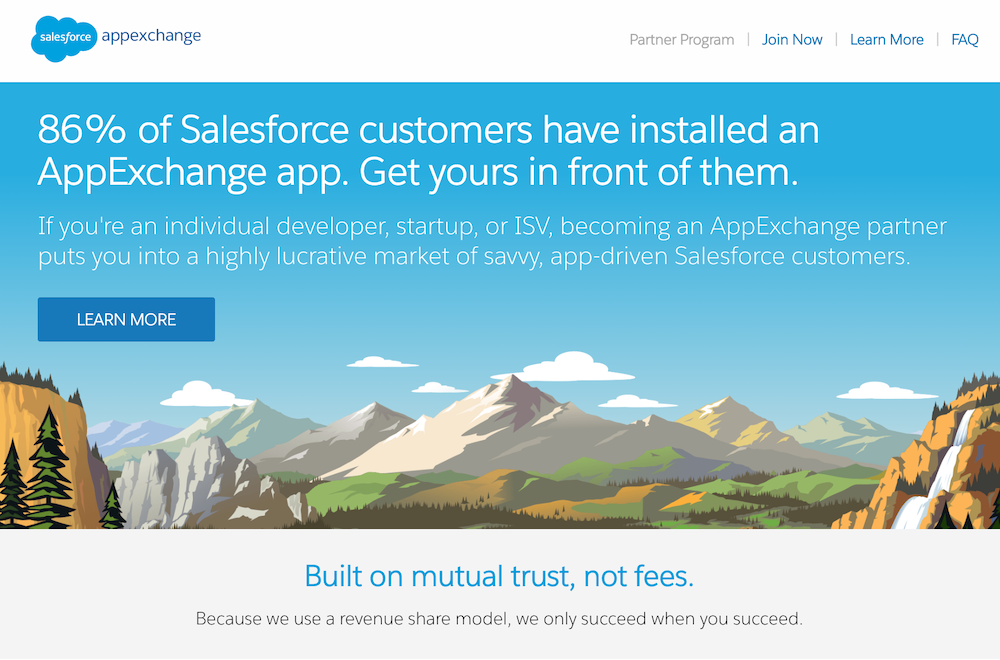
This is why software companies like Salesforce might have a marketplace, where they’ll make between a revenue percentage from apps sold through their service…
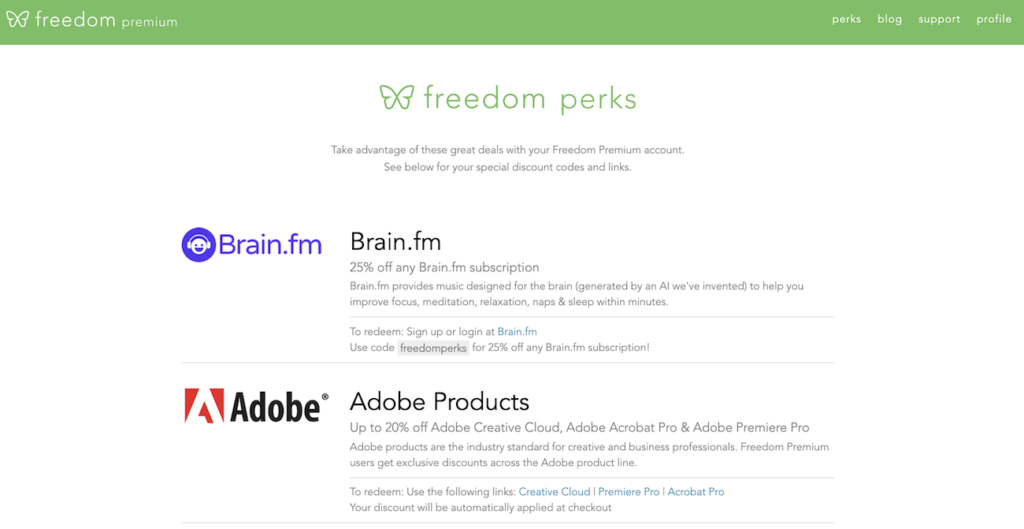
…or Freedom, who partners with other companies to offer members-only perks, which likely operate the same way as an affiliate program.
The point of improving your customer lifetime value, as David points out, is to ultimately create balance in your business model that allows you to offset the unavoidable high-cost factors that inevitably go along with running your business.
He also emphasizes doing continuous optimization to build a sales and marketing machine.
Seriously—read his post when you get the chance.
Determining your customer acquisition costs (CAC)
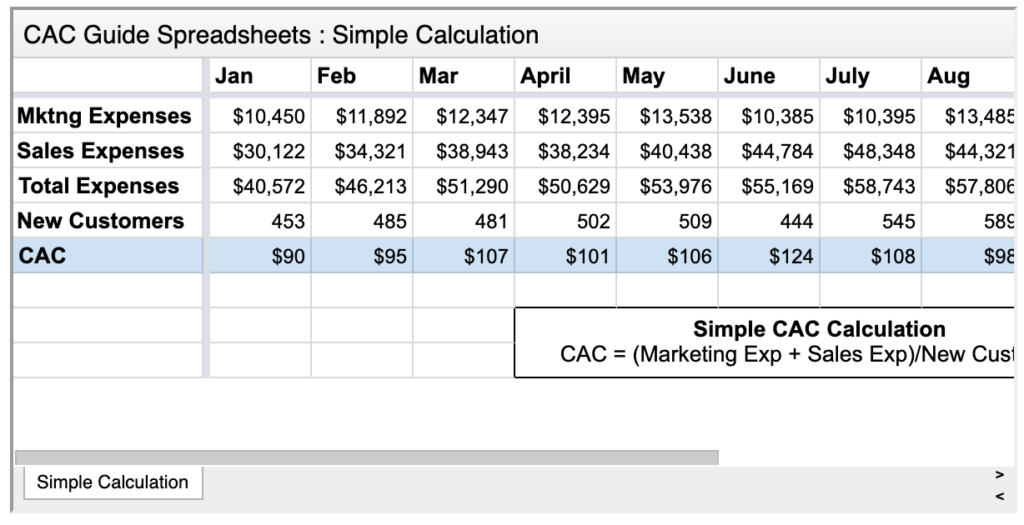
Ok, so now for the math. Let’s start with the basics. The simple way of finding your your customer acquisition cost is to divide the total amount of marketing and sales dollars by the amount of actual customers that come from those efforts. (Total marketing + sales expenses / number of new customers = customer acquisition cost.)
Of course, this is an overly simplistic view of the entire process, but if you’re not currently measuring anything, I’d recommend you at least start there.
If you want to get deeper than than, Brian Balfour (HubSpot’s former VP of growth) wrote about CAC in-depth and covered some myths and potential mistakes when calculating your customer acquisition cost.
Brian claims that the above CAC formula is correct on the surface, but lacks details and definitions.
He then makes calculations with some sample data…
…and adds the following caveats:
- It takes about 60 days for a lead to become a customer.
- Not all customers are new—some are returning.
- This is a freemium product; there are costs of supporting those users before they start paying.
From here, he poses some key questions you should ask yourself (and adds key examples to help you answer them):
- How long does it take between your marketing/sales touchpoints and when someone becomes a customer?
- What expenses do you include in your marketing and sales costs? Most common mistakes are not including salaries, overhead, and money spent on tools.
For example, Spotify has millions of freemium users, which means there are certain costs to support them. HubSpot has a large customer success team, purely devoted to churn prevention, and it’s important to decide whether to include this in CAC calculations.
Similar dilemma goes for a subscription business like Dollar Shave Club. For example, their starter set promotion costs $15 while the full subscription for those same products is $75. Dollar Shave Club still has to pay for packaging, shipping, support, and more, despite not having the customer on the full plan yet.
As with many things, these calculations and decisions will depend on your industry and business model. Be sure to check out Brian Balfour’s article and the accompanying spreadsheets.
Calculating your customer retention rate
This is where it starts to get fun.
If you’ve been doing business longer than a few months, pay attention to your customer retention rates. Before you can determine the lifetime value of your customers, you should have some idea of how long they’re going to be sticking around.
In order to calculate your customer retention rate, you need to know:
- Number of customers at the end of the period – E;
- Number of new customers acquired during that period – N;
- Number of customers at the start of the period – S.
Once you have those, the formula is pretty straight-forward:
CRR = ((E-N)/S)*100
So to make things simple, let’s say you started the quarter with 200 customers (S), you lose 20 customers but gained 40 customers (N) so when the period was over you had 220(E).
Using the formula we’ve got ((220-40)/200)*100=90 or in other words, a 90% retention rate. Good for you!
Word of caution: Before we go any further, I must stress that you should not be running this calculation to find the average across your entire customer base! Broad sweeping averages like this could provide you with potentially damaging figures if you’re not careful.
The issue is that blending customers into an “average” significantly distorts reality. If you gain two customers—one with a retention rate of 100% and another with a retention rate of 0%—you can imagine how the situation would play out. The first customer would pay forever, and the second would leave right away.
However, if you first average the two retention rates together, you’ll have two customers with a 50% retention rate.
From Corey Pierson on Custora
An example of what an averaging all customers together might look like is this:

Pretty bleak, right? In eight months you will have no customers. “Invest everything you can into acquisition, because they’re all going to be gone!”
Corey goes on to show what calculating retention rates the right way over three customer groups (Group Awesome, Group OK, and Group Sad) might look like:

This is a far more realistic and, more importantly, this data makes it easier to make projections, budget allocations, and have a baseline to build strategies.
If you haven’t already segmented your customer base, I recommend reading this guide by Christopher Gillespie on Mixpanel, as it will give you some ideas around how and why to segment your customers.
Calculating your churn
On the opposite side of retention, you’ve got churn—the rate of which customers (naturally) stop buying from you.
In an ideal world, figuring out your customer churn looks as simple as this:
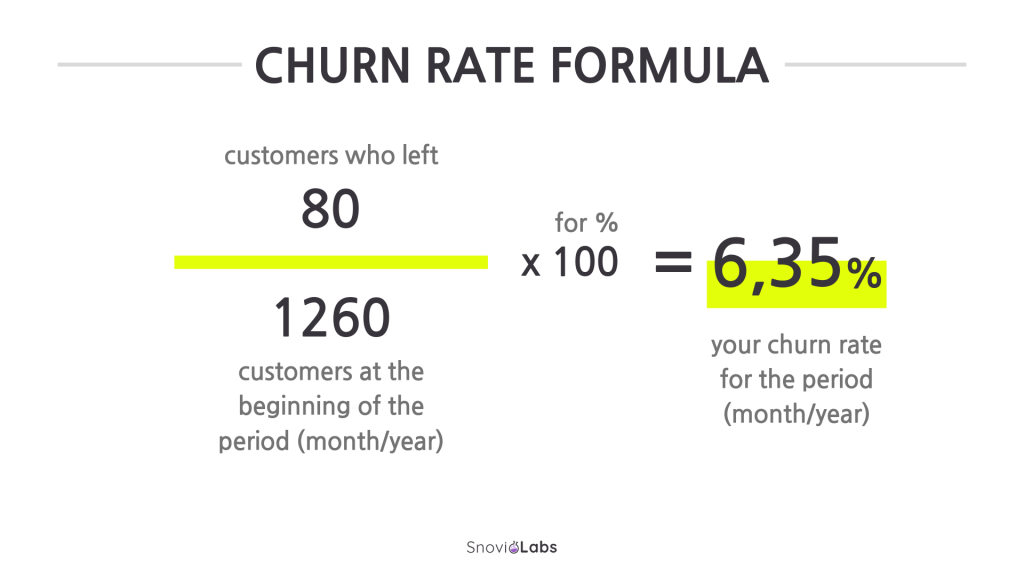
Now, if you’re not currently measuring churn, this is an alright place to start. At least you’ll have something to benchmark so you can reduce your churn rate later.
But like Steven H. Noble talks about in this blog post on Shopify, it is not always that simple.
Variables like customers gained during the period, how long the timeframe you’re measuring, and whether or not churns are occurring evenly over the period, all factor into what your actual churn rate is.
If you want a realistic view of your churn rate for predictive analysis purposes, you need a formula that looks more like this:

with the weights being

What this metric is useful for is keeping track of changes in customer churn behavior while giving a rough estimate of what percentage of your customers will leave in the next 30 days.
If this kind of math scares you (it sure scares me), don’t worry, Steven gave us an interactive spreadsheet you can download to plug your own numbers into. (Be sure to stop by Steven’s blog and say thank you!)
It’s important you keep this data as accurate as possible in to measure the impact various retention strategies have on your customer base.
Calculating a more accurate customer lifetime value
There are several different ways to measure customer lifetime value and the infographic from Kissmetrics will cover a few in the next section.
But for now, we’ll use this really basic LTV equation:
(Average value of a sale) X (Number of repeat transactions) X (Average retention time in months or years)
Brad Sugars on Entrepreneur.com offers a very simple example of a gym member who spends $20/month for their membership for three years.
$20 x 12 months x 3 years = $720 in total revenue (or $240/year)
Now you could use this, but if you’re a gym owner thinking a large portion of your customers would be with you for three years, you’re delusional.
Averages lie. Again, I can not stress enough: segment your customers if you want to get an accurate picture of the data.
If you really wanted to know the lifetime value of your members, you’d have to consider the customer segments that:
- Pay for personal training and group coaching;
- Buy supplements;
- Pay for additional classes;
- Buys t-shirts, gear, refreshments.
You’d also need to analyze this data to find correlations between the members who stay and those who churn quickly.
- Do people who sign up for classes have a tendency to have longer retention rates?
- Is there any relation to people enrolling in personal training and supplements?
- Do high churn customers also buy more gear?
Finding the lifetime value of these individual customer segments will give you a very clear idea about the value each type of customer will bring to your business. Once you know that, you can make data driven decisions about how much to invest in acquiring each customer type.
Beyond that, you can use what you learn to create upsells and cross-sells to increase the lifetime value of each customer segment (e.g., 10% off supplements when you sign up with a personal trainer, half off t-shirts when you sign up in January).
A hypothetical scenario: Starbucks
In this infographic by Kissmetrics, they illustrate various ways to calculate customer lifetime value.
Disclaimer: Commenters on the original post did point out a few issues (detailed after the graphic), but there is still a lot to be learned here so please take it all in:
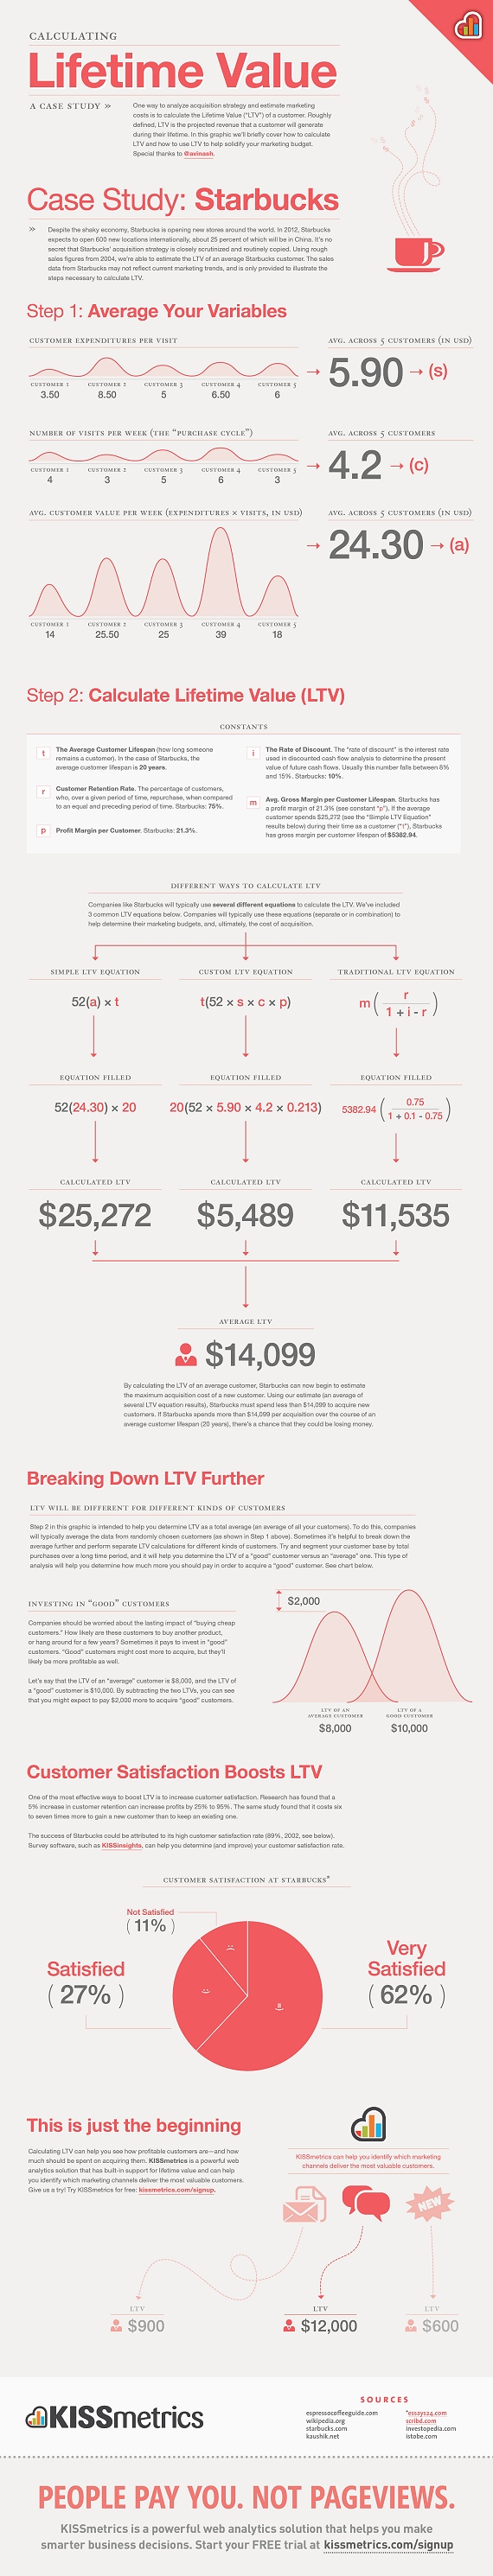
Even though there are some fundamental flaws, I wanted to share this with you because it is a perfect example of why you have to keep working with the data until you get something accurate.
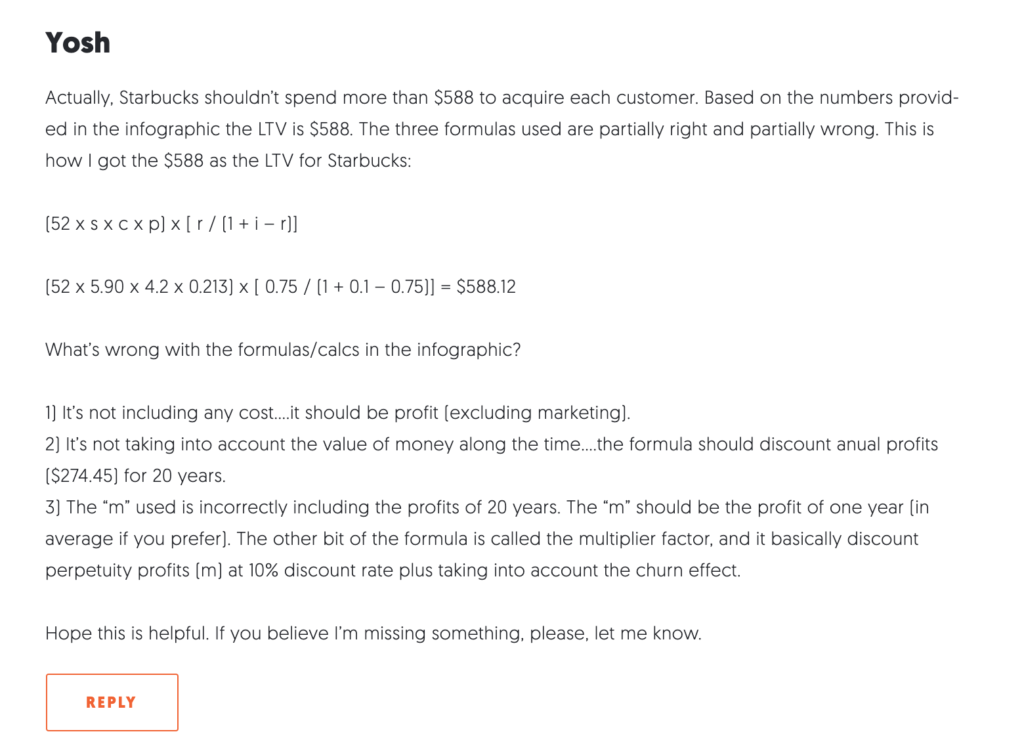
What did the commenters find wrong?
- Averaging revenues + profits (like they did with the total average) ultimately breaks the equation.
- It doesn’t consider the costs associated with delivering the product.
- It should factor in discounts and discounted profits.
- The sample size (five customers) is probably too low for a company like Starbucks.
Of all the commenters, Yosh gave what appears to be a viable solution:
Imagine how much money you’d lose if the projections were wrong.
I know it’s a lot to take in, but it’s important you realize that data is unique every business and situation. It’s never as neat as using one catch-all formula and applying it across the board.
That’s why there are several different methods of calculating customer lifetime value.
Realistically, these formulas should only be used as a starting point to understand your customer behavior and then tweaked to fit your business.
This is why you need a good CFO, even if it’s just in the interim.
The effects of increasing customer lifetime value (micro case studies)
You’ve already come a long way and I don’t want to take up too much more of your time. But I wanted to share these three case studies of companies seeing explosive results after nailing their customer lifetime value:
- IBM increases revenue by 10x by correctly identifying and marketing to high spending customers
- SurveyMonkey increases LTV by 150% by identifying most profitable geo-demographics
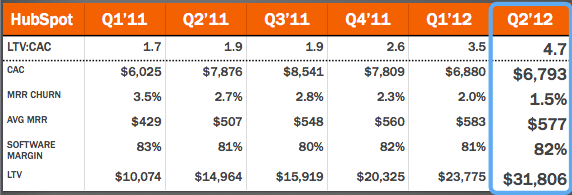
- HubSpot reduces churn by 57% and increases LTV by 215.72% in a year and a half
Conclusion
This quote on Forbes perfectly sums up everything we’ve been talking about:
Brad Coffey, head of corporate development for [HubSpot], likens the formula to a machine: Put a dollar in at the top and the LTV:CAC ratio will tell you roughly how many dollars come out at the bottom. If your money isn’t multiplying, you’re going to want to spend some time tuning that machine.
Bonus: Six quick tips to improve customer lifetime value
- Use email to preemptively answer common questions, upsell, and provide customer education.
- Cross-market and provide lead generation for companies with similar customer bases.
- View every customer interaction as an opportunity to improve customer loyalty.
- Find ways to build habits around your product.
- Make customer service easy. According to Harris Interactive, 56% of customers will switch brands if the alternative offered more ways to connect.
- Incorporate customer feedback to improve everything from user experience to product features and design.
Related Posts
-

What did you do last Sunday? Well I had breakfast with Brian Massey, The Conversion…
-
If you want to double your results, you can either double the number of visitors (very…
-
Conversions are mostly about being relevant to your customers. If what you offer and the…
-
Today I'm reviewing value propositions of several websites. Value propositions are critically important - especially…


One of most thorough articles on LTV I’ve read. Thanks.
One of the most important reasons for increasing LTV for my clients isn’t just profitability. But if your LTV relative to your competitors is higher, you can out-invest them in customer acquisition.
If company X has an LTV of $1000 and Company Z has a LTV of $2500, and they are both competing for the same PPC keywords – who wins?
The higher the LTV, the crazier the things you can do on the front end. Stuff that may seem insane (and is) for your competitors.
That’s a great point Robert, if your CLV is higher, you can own your competition across the board when it comes to acquisition.
I wanted to mention T-Mobile’s current “buy out your contract” offer that they’ve got going on, because it seems like perfect example of this in action, but I just couldn’t find a way to work it in properly.
One of the main things I thought was really cool about nailing these metrics was just how much you can put your competition on the ropes when it comes to sniping their customers.
In the “buy out your contract example” the only counter AT&T might have to that is to start offering lower cost contracts or extra data to retain the customers who may end up leaving.
This of course eats away at their own CLV & depending on how successful T-Mobile is, erodes their mobile business.
Math wars. It’s nuts.
Perfect timing. I was searching and trying to get a better idea of my LTV yesterday.
The one difficulty I’m having is that my members pay annually. So instead of a monthly churn, I do get some refund requests. How do you think I should be tracking churn and LTV?
Dig into your metrics to see if there’s any correlations between login frequency and refund requests.
My hunch is, you’ll find that infrequent log-ins also turn into refundees.
To combat that, you could look into sending triggered emails when engagement dips down.
In terms of churn, use the spreadsheet Steven provided & instead of tracking days, track months. That should be a good place to start.
Good article. Far too many marketers choose NOT to obsess over LTV and CAC and choose instead to spend time crafting offers or stunt marketing. I was taught early on that “First, you have to calculate.” (Said in a Swedish accent by one of my mentors.)
I disagree with your assertion that you need a good CFO. Any good marketer worth his/her salt should be able to model this out without help from Finance, including taking into account the internal hurdle rate and time value of money. The math is quite simple (and Google-able nowadays).
I agree, any good marketer should be able to calculate this no problem,
I didn’t really unwrap my logic behind having a good CFO, but it goes far deeper than being able to do these basic calculations.
Really, it’s about being able to run the numbers that also factor in the extra ancillary factors, like discounts or theft, or forecast worst case scenarios like a data breeches, negative press, power outages, planned & unplanned downtime etc.
As a marketer, it’s great to build the budget based solely on LTV & CAC, but in some ways it’s too idyllic.
Think back to when Amazon went down & it was estimated they lost 4.72 million in sales: http://venturebeat.com/2013/08/19/amazon-website-down/
An event like this would dramatically impact the figures for CAC and LTV, so in order to insulate against events like that, they’re more likely working with a heavily modified equation somewhere within their multiple customer segments to make sure it everything balances out and the blow is softened.
Wow great post Tommy. I put together a little calculator that we use to do a quick calculation for Customer Acquisition Cost you might find useful http://wpcurve.com/cpa-calculator
We are looking at ways to boost LTV right now, this post is going to help us A LOT!
So thank you.
Great post; clear presentation of very good data. Provides a solid foundation for our PPC recommendations.
Hey Tommy, fantastic article. Also slightly daunting. I’ve never been good with maths and I’ve focused on just creating cool products that people like, and then upselling even cooler products that people like even more. That’s working so far for me. But I’ve also realized with paid traffic I need to start taking my numbers a lot more seriously. There are so many things in this article I am NOT doing. But you have to start somewhere, right?
oh boy oh boy oh boy :), here comes a new pipeline of optimization projects in my business.
Thank you for this insightful and thorough post.
Will visit this regularly over the months.
I know CAC but can you please provide real-life CAC values for startups and big companies.
It’s almost impossible to find sample CACs that help you determine if you are doing things wrong or right.
Trust me, I looked as hard as I could to find real world CAC values, but the truth is, they’re impossible to find because it’s one of the most valuable metrics to any business.
Imagine for a second your competition got a hold of your CAC value… they’d just spend more to acquire your customers, even if it meant short-term loss.
Really though, looking at someone else’s numbers to validate your own is sort of a losing exercise. There are so many circumstances that factor in, that you’re never really going to get the full picture.
The best thing you could do is take the data that you have, and find a good person to process it (if you’re having a hard time processing it yourself, that is) so you & only you know what a customer is worth to your business.
I wish I could give you something different, or provide you with a real world cost, but unfortunately I was not able to find any of that in my research for this piece.
Hi there! Would you mind if I share your blog with my myspace group? There’s a lot of people that I think would really appreciate your content. Please let me know. Many thanks kbdcbdcagc
Very nice site!
Tommy,
I’m a new fan. Another awesome post. However, I am once again challenged – this time, mathematically.
I’m playing with a consumer lending/business financing setup and trying real hard to come up with a formula to go with for the CLV. Any ideas?
Thanks!
Hmm…without looking at the customer data, it’s kind of hard to say.
Does starting with the basic formulas in here not work?
Actually, after that comment of mine, I’ve gone and done a lot of those formulas and I think I’m getting somewhere.
Let’s see how it goes, will keep ya’ll informed.
Im grateful for the blog article.Much thanks again. Cool.