While testing is a critical part of conversion optimization to make sure we actually made things better and by how much, it’s also the tip of the iceberg of the full CRO picture. Testing tools are affordable (even free), and increasingly easier to use – so pretty much any idiot can set up and run A/B tests. This is not where the difficulty lies. The hard part is testing the right things, and having the right treatment.
The success of your testing program is a sum of these two: number of tests run (volume) and percentage of tests that provide a win. Those two add up to indicate execution velocity. Add average sample size and impact per successful experiment, and you get an idea of total business impact.
So in a nutshell, this is how you succeed:
- Run as many tests as possible at all times (every day without a test running on a page/layout is regret by default),
- Win as many tests as possible,
- Have as high impact (uplift) per successful test as possible.
Executing point #1 obvious, but how to do well for points #2 and #3? This comes down to the most important thing about conversion optimization – the discovery of what matters.
Table of contents
Some things and places matter much more than others
Let’s say you run a B2B site, and drive your visitors toward a quote request page. You might spend your precious testing time experimenting with different headlines, only to find that there’s no or very little difference between them (no impact on the final conversion).
You might be optimizing the wrong thing. Spending your time on something else is where the gains are. Maybe it’s the form, maybe it’s the pages they were on before they got to the quote request page, maybe something else.
Or you might spend tons of effort on your ecommerce product pages, only to find that even if you get wins, the financial impact on your business is negligible. You might be optimizing in the wrong place. Significant gains would be had if you’d spend your time fixing your biggest leaks instead.

This is why the discovery of what matters is important. If you figure it out, you know WHAT to optimize, and WHERE. One huge step closer to more winning tests with bigger impact.
You can learn what matters through testing and research. But testing without research will result in tons of wasted tests.
It’s not about a list of tactics
Let me make this clear: conversion optimization is not a list of tactics, or a list of best case practices. Best case practices are mostly common practices anyway – not the best. You won’t increase the amount of tests that win by maintaining a list of tactics, and then trying them out on your site.
The quickest way to figure out whether someone’s an amateur or a pro is this: amateurs focus on tactics (make the button bigger, write a better headline, give out coupons etc) while pros have a process they follow.
If you can’t describe what you are doing as a process, you don’t know what you’re doing.
– W. Edwards Deming
Why people think it’s about tactics is obvious: lots of blog posts out there tell you so. Make the button bigger/orange/round and you get 212% lift on average! Some blog posts even give you complete lists of conversion optimization techniques (never mind that there is no such thing as a CRO technique).
Conversion optimization is being SEO-fied more and more: rubbish content is starting to be more widespread than high quality content – and people looking get into CRO can’t tell the difference. There are 2 reasons for this:
- most content is written by writers, not practitioners – and they don’t know what the f they’re doing
- people writing the content are doing it for the sake of ranking better (get conversion optimization keyword traffic, backlinks), and not to actually add value to the community.
It’s hard to fix this issue, so be careful whose advice you buy. A good start would be to ignore/be skeptical of advice given by writers / professional bloggers.

Note that I’m not saying that tactics don’t work, but you shouldn’t think in terms of tactics. Tactics come later – first you need to figure out what are the issues with your website.
You don’t have generic problems. You have specific problems
Following global marketing trends, copying your competitors and implementing best case practices don’t work for this reason: websites are highly contextual.
What works for a website, doesn’t work for another. If copying Amazon would be all that it takes to grow your e-commerce business, there would be many more Amazons around. Doesn’t work like that.
You sell to trendy high school kids with very little money, I sell yachts to millionaires – highly different context, right? Well, what if we both sell food items? But you are Wal-Mart, and I am Whole Foods. Highly different context. Even if we sell the same products to the same demographic, many things can be different – traffic sources, relationship with the audience, customer support etc. It’s almost never apples to apples.
This is also why it’s useless to copy A/B tests from sites like WhichTestWon, and hope for the same result. Stop that. Websites are highly contextual.

You don’t have generic problems, nobody does. You have highly specific problems.
The good news is that you can know exactly what those problems are, where they are, and how a large sample of your visitors are (negatively) impacted by it.
How? By using a methodical research process, and data.
The problem with being “data-driven”
We should all be more data-driven (or data-informed), right? Well, the truth is data doesn’t tell you anything. It’s not like you open up Google Analytics and the data will come telling you stuff. No.
You have to ask questions first, and then you can seek for the right data that might help you find an answer. Data is just there, it’s up to you to interpret it and to pull insights out of it. It’s a skill. Work hard to get better at it. Google has a course (discontinued) on making sense of data, that’s a great starting point – but there’s no substitute to real-world practice.
How much data do you need?
Let’s say you want to cross the road. If you have all the information you could possibly have, you’d have data on the shapes of leaves on trees across the street, air humidity, colors of the houses around you, hairstyles of people standing next to you and so on and so forth. But what really matters is whether there’s a car coming, and how fast.

It’s the same with conversion optimization. You could have an in-house user research lab with fancy neuroscience technology and 25 researchers, actively track 5000 metrics across 500 segments and what not – but it would not only cost a lot (likely way more than the profit from testing wins), it would be distracting and silly. The more research activity you add, the higher the cost – and inevitably the law of diminishing returns kicks in.
The opposite, of course, is just going by gut feeling, opinions and best case practices. That’s equally stupid.
The golden path is in the middle – do enough research that gets you the insights you need to find opportunities for growth without the high cost.
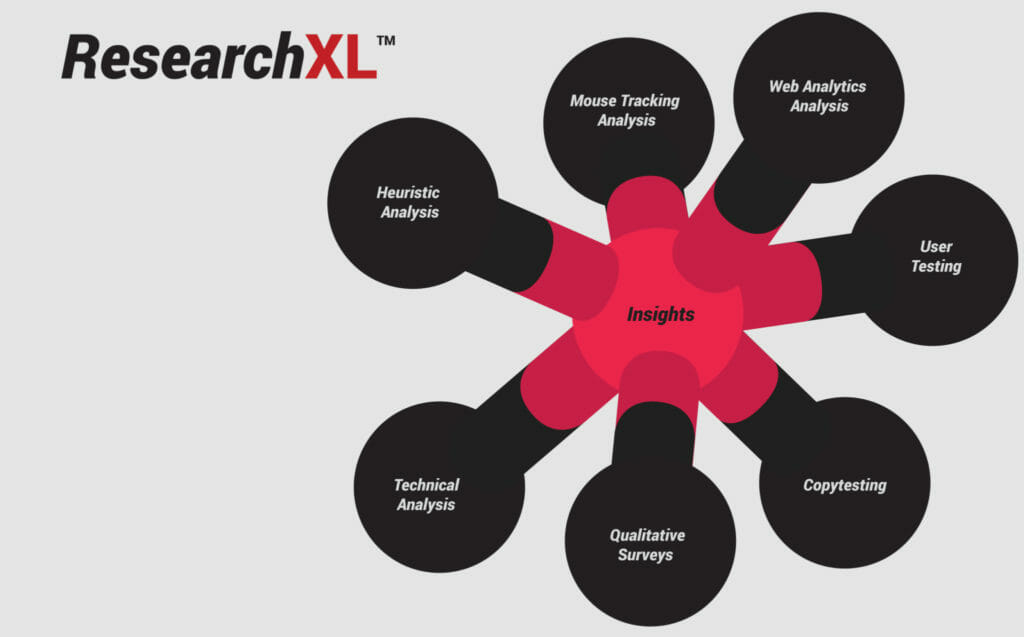
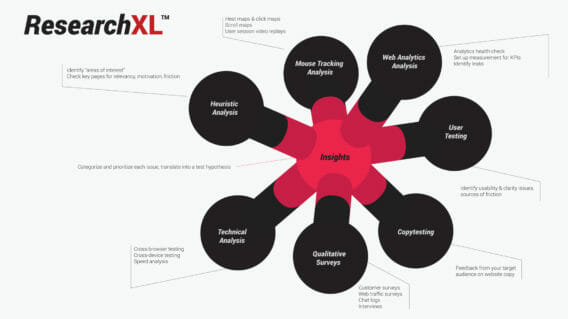
Introducing: ResearchXL™ framework
The art and discipline of conversion optimization is a very new field. Until recently, you couldn’t really learn it anywhere (monster course now available). When I got started in CRO, I read all the books and blogs like other people, but my biggest source of learning was other people. People who had been doing this for a while with great success.
Of course, there’s no substitute to actually doing it. My own real-world experience combined with the teachings of others lead me to a conversion research process that I’ve been now using for the last 3 years. It’s proven to work across industries and business models. B2B and B2C. SaaS, e-commerce, lead gen, affiliate models. It doesn’t matter which vertical you’re in, you can use it to find great insights to lead to better test hypotheses.
ResearchXL is a framework that will help you discover what really matters, so you can increase the number of winning tests, and increase the impact per successful experiment.
There are 6 steps of data gathering and analysis, followed by creating a master sheet of all found issues that we then turn into action items.
It might look scarier at first glance than it really is. Go through it once, and it will be so much quicker next time. It just makes sense. (If you want me to teach it to you, sign up for my next coaching program).
Use the framework as your tool, your guide, your process map. Customize it and improve however you see fit. This is where you start, not where you end up.
Learn the basics of Research-Driven Conversion Optimization in 1 hour!
Get the Free Course | Click to watch the course introduction
Step #1: Heuristic Analysis
Let’s start with a definition: heuristic analysis is an experience-based assessment where the outcome is not guaranteed to be optimal but might be good enough. Its main advantage – speed. It can be done fairly quickly.
This is as close as we get to using opinions to optimize. But – there’s a difference between an opinion and opinion. The opinion of an experienced optimizer matters a lot. The sheer volume of pages and tests a person sees over the years makes a difference. An analogy: an art dealer who sees and sells thousands of paintings over the years will have a much better guess at a painting’s value than a random person on the street.
That’s why heuristic analysis done by an experienced optimizer is way more productive than just randomly sharing stupid ideas. But even without the experience is productive because it’s structured – not random commentary or criticism.
In essence, this is us – optimizers – reviewing a website, page by page, based on our experience of what we’ve seen work before, “best practices” and stuff like that. BUT – we do it in a very organized, structured manner.
AND – most importantly – whatever we identify or discover through heuristic analysis is not the truth (since it’s still kind of an educated opinion). The outcome of it is what I call “areas of interest”. And in our next phases of conversion research – qualitative and quantitative research – we seek to validate or invalidate the findings.
What does the structured website review look like? We assess each page for a certain set of criteria:
- Relevancy: does the page meet user expectation – both in terms of content and design? How can it match what they want even more?
- Clarity: Is the content / offer on this page as clear as possible? How can we make it clearer, simpler?
- Value: is it communicating value to the user? Can we do better? Can we increase user motivation?
- Friction: what on this page is causing doubts, hesitations and uncertainties? What makes the process difficult? How can we simplify? We can’t reduce friction entirely, we can only minimize it.
- Distraction: what’s on the page that is not helping the user take action? Is anything unnecessarily drawing attention? If it’s not motivation, it’s friction – and thus it might be a good idea to get rid of it.
Further reading: https://cxl.com/blog/how-to-increase-sales-online-the-checklist/
During the process of heuristic analysis you have to avoid random comments, and strictly stick to assessing the page for named criteria – writing down your “findings”.
Heuristic analysis works best when done in a group – including fellow optimizers, designers, usability people, copywriters, and janitors. Just remember to explain the rules to everyone at the start.
And remember – whatever you write down are mere “areas of interest”, not the absolute truth. When you start digging in the analytics data and putting together user testing plans and what not, make sure you investigate that stuff – with the intention to validate or invalidate whatever you found.
Step #2: Technical Analysis
Don’t even think about anything else until we’ve fixed all the technical stuff. Bugs – if they’re around – are your main conversion killer. You think your site works perfectly – both in terms of user experience and functionality – with every browser and device? Probably not.
This is a low-hanging fruit, one that you can make a lot of money on (think 12-month perspective).
Conduct cross-browser and cross-device testing
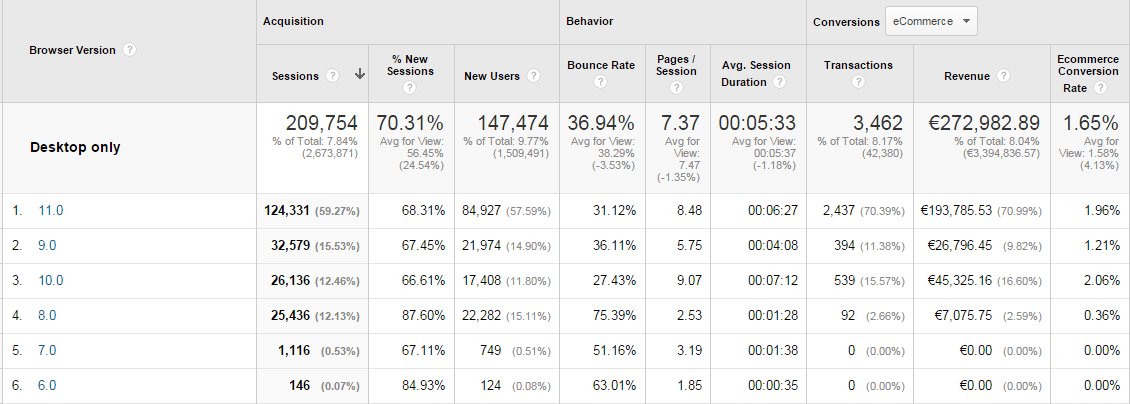
Open up your Google Analytics and go to Audience -> Technology -> Browser & OS report.
You will see the conversion rate (for the goal of your choice) per browser. Note: You must look at the one device category at a time – to apply a device segments first: desktop only, tablet only and mobile only. You can’t pile all device categories into one, or you will be fooled by averages.
You need to drill down to a specific browser version (e.g. IE8, IE9 etc) – and see if a particular browser converts less than others. When looking at the report below, we can see that IE9 and IE8 convert less than IE11 and IE10. What’s up? While it could be that people using older versions of IE are just some stupid old people not spending money, but it might also be that you’re the stupid one losing money due to some bugs or UX issues.
You don’t need to own all the devices and you don’t need all browsers installed on your machine to see what your website looks like on every browser/device. Use services like https://crossbrowsertesting.com and http://www.browserstack.com.
“But no one uses IE8 (or whatever lesser used browser)!”
That’s an opinion. If you find a low-performing browser that’s not used very much, do this:
- Look up the number of IE8 visitors per month.
- Look up the average transaction amount. Let’s assume it’s $50 for this example.
- Calculate: if IE8 (currently converting at 2%) would convert the same as IE10 (currently 5%), how many more transactions would we have over 6 month period? Let’s pretend that we’d get 200 transactions more over 6 months.
- Multiply that number with avg transaction amount ($50), so 200×50=$10,000
- How much time will it take to identify and fix the bug? 3 hours? Is 3 hours of developer time more or less than $10k? If less, fix the damn bugs!
Repeat this flow with each browser that’s converting sub-optimally.
Speed analysis
If your site it too slow, it might have a negative impact on your results.
Key thing to know – there’s a difference between “page load time” and “page interactive time”. The first one means “seconds until every element on the page has done loading” and second one means “seconds until the site is usable”. The latter is much more important, it’s the key metric you want to pay attention to.
If the site loads within 3 seconds, you’re doing fine. Up to 7 seconds? Quite typical, can be improved. More than 10 seconds? Gotta do something!
Where to look for site speed data: Google Analytics: Behavior → Site Speed → Page Timings. Turn on the ‘comparison’ to easily spot slower pages:

You want to look at page load time and page interactive time per page – starting with the ones that have the most traffic (== affect the largest number of users).
Mark down all URLs that load with sub-optimal speed. Use Google PageSpeed Insights (can also be accessed from within GA). Enter every URL you wrote down, and it will list all the found issues.
Further reading
Step #3: Web Analytics Analysis
When doing optimization work, Google Analytics is your best friend. If you’re not very skilled at it – most marketers aren’t – you’re missing out. You need to take the time to learn. Your career depends on it.
Gone are the days when a brilliant idea – a result of a brainstorm in the marketing department – was enough. Now you need to know the specific impact of every idea.
You have a strategy? Great, measure it. You added a new feature to your website. Well – how many are using it? Are people using it more likely or less likely to convert?
If your Google Analytics skills max out at checking how much traffic you’re getting, which country they’re coming from and how many minutes on average they spend on your site, you know nothing. This is useless for CRO purposes.
Note for analytics newbies: Google itself has released a pretty good introductory course called Digital Analytics Fundamentals – I suggest you take it.
What can we learn from Google Analytics?
This topic would take a three day workshop, but for this essentials course I will point out the key stuff.
Always approach analytics with a problem: you need to know in advance what you want to know, and what are you going to change / do based on the answer. If nothing, then you don’t need it.
In a nutshell, we can learn:
- what people are doing,
- the impact and performance of every feature, widget, page,
- where the site is leaking money,
… but we won’t know why. Heuristic analysis and qualitative research are your best attempts at figuring out the ‘why’. Analytics is more like ‘what’, ‘where’ and ‘how much’.
Follow the data!, they say. Well, truth be told, data won’t tell you anything. It is up to you to pull the insights out of the data. And this requires practice. As with everything – the more time you spend at looking at data, and trying to make sense of it, the better you’ll get at it.
Before the analysis, make sure the data is accurate and that everything important is being tracked
If you work with a Google Analytics setup that was done by someone else, you need to start with an analytics health check. In a nutshell: health check is a series of analytics and instrumentation checks that answers the following questions:
- “Does it collect what we need?”
- “Can we trust this data?”
- “Where are the holes?”
- “Is there anything that can be fixed?”
- “Is anything broken?”
- “What reports should be avoided?”
The truth is that nearly all analytics configurations are broken. Take this very seriously.
Setting up goals and measurement, using the interface
- Google Analytics 101: How To Configure Google Analytics To Get Actionable Data
- Google Analytics 102: How To Set Up Goals, Segments & Events in Google Analytics
- Using Google Tag Manager
Digging for insights
- 7+ Under-Utilized Google Analytics Reports for Conversion Insights
- 10 Optimization Experts Share Their Favorite Google Analytics Reports
- 10 Google Analytics Reports That Tell You Where Your Site is Leaking Money
Step #4: Mouse Tracking Analysis
We can record what people do with their mouse / trackpad, and can quantify that information. Some of it might be insightful.
Very important: like with A/B testing, you need enough sample size per page / screen before you can trust any results. A rough ballpark would be 2000-3000 pageviews per design screen. If the heat map is based off like 34 users, do not trust any of it.
Two most interesting types of heat maps to look at are click maps and scroll maps.
Click maps
A click map is a visual representation, aggregated data of where people click. Red equals lots of clicks.
So there is one useful bit here I like – you can see clicks on non-links. If there’s an image or text that people think is a link or want to be a link, they’ll click on it. And you can see that on a click map.
Scroll map
This shows you scroll depth – how far down people scroll. Can be very useful.
It’s absolutely normal that the longer the page, the less people make it all the way down. So once you acknowledge this, it makes it easier to prioritize content. What’s must-have and what’s nice-to-have. Must have content must be higher.
Analyzing the scroll map will also help you decide where you need to tweak your design. If you have strong lines or color changes (e,g. white background becomes orange), those are called ‘logical ends’ – often people think that whatever follows is no longer connected to what came before.
So you can add better eye paths and visual cues to spots where scrolling activity seems to drop heavily.
User session replays
You can record video sessions of people going through your site. It’s kind of like user testing, but has no script and no audio. But people are risking with their actual money – so it can be more insightful.
You don’t need a million visitors to record user sessions – this is almost like qualitative data. Use tools like Inspectlet (great), Hotjar (great) SessionCam (terrible UI, but a workhorse), or Clicktale to record user sessions, and watch your actual visitors interact with your site. Some basic heatmap tools like Crazyegg don’t even have this feature.
Session replays are extremely useful for observing how people interact with your site.
Form analytics
Not exactly mouse tracking, but several mouse tracking tools like Hotjar, Inspectlet or Clicktale have this feature. Or for more powerful form analytics use a standalone tool like Formisimo.
These tools will analyze form performance down to individual form fields.
- Which form fields cause the most error messages?
- Which form field people hesitate to fill? Hesitation measured in milliseconds
- Which form fields people leave empty, even though they’re required?
And so on.
If your goal is to make your forms better – and form optimization is a key part of CRO – it really adds a whole new layer of insight where you have data about each and every form field.
Step #5: Qualitative Surveys
On-site surveys
Most people on your site will not buy anything. How can we get more people to buy? One thing that helps us figure that out is website surveys.
There are 2 ways to survey your web traffic:
- Exit surveys: hit them with a popup when they’re about to leave your site.
- On-page surveys: ask them to fill out a survey as they’re on a specific page
Both are useful.
There are many tools to use that, I usually use Qualaroo (most advanced) and Hotjar, but there are many other tools. The tool itself doesn’t matter as long as it gets the job done:
- Configure which page(s) will have the survey on
- Set your own questions (no pre-written template bullshit)
- Determine the criteria for when to show the survey
If these 3 criteria are met, you’re solid.
Aren’t surveys annoying to people? Sure they might be to some – but the data you get out of it is well worth it. And you typically only run the surveys for a limited period of time.
What should you ask?
Remember the key: actionable data. We need information to act on.
Since our goal is to get more people to take action, start with learning about friction. What are the FUDs (fears, doubts, hesitations) they are experiencing – while on a specific page?
Every page on your site has one job – and your survey question should be about that one page, one job.
Customer surveys
Send an email survey to recent first-time buyers. These are people who still freshly remember their purchase, and the friction they experienced in the buying process. Only survey people who have no previous relationship or experience with you that might affect their responses (you want to filter out repeat buyers or people who bought a long time ago).
Try to get in ~200 responses. If you get more than that, the answers tends to get repetitive, and don’t offer additional insight. Remember – this is a qualitative survey, not quantitative (like opinion poll). Any less than 100, and there might not be enough answers to draw conclusions from.
If you have less than 100 people who recently bought from you, then you do with what you can get. 10 responses is better than zero.
Important: the quality of the questions will determine the quality of the insight you will get. Don’t ask Y/N questions, avoid multiple choice.
Further reading
- How to Use Qualitative Research to Drive Conversions
- How to Identify Your Online Target Audience and Sell More
Step #6: User Testing
The premise is simple: observe actual people use and interact with your website while they’re commenting their thought process out loud. Pay attention to what they say and experience.
User testing gives you direct input on how real users use your site. You may have designed what you believe is the best user experience in the world, but watching real people interact with your site is often a humbling experience. Because you are not your user.
Note: the quality of the tasks you give testers will determine the qualify of insight you will get.
In most cases you want to include 3 types of tasks in your test protocol.
- A specific task
- A broad task
- Funnel completion
Don’t ask for their opinions, just observe what they do and voluntarily say.
Step #7: Copy testing
Copy is the biggest driver of conversions in most cases.
The problem with improving your copy is that you don’t have data on what needs work. What parts of the copy help you increase the conversion rate, what hurts your sales – and why?
Copy testing is about putting your copy in front of your audience, and learning how they perceive it.
Conducting copy testing will help you answer:
• What does your headline make them feel?
• Do they care about the arguments you’re making?
• Which benefits are they most interested in?
• Do they even understand the copy in the third paragraph?
• After reading everything, what remains unclear?
You can do this via qualitative research interviews (recruit 15-20 people from your audience, formulate research questions about your copy, then conduct interviews, compensate panelists), or by using Wynter.
It’s the only tool that gives you answers from your actual target audience—in a matter of hours.
Step #8: Put everything together in a master action sheet
Once you go through all 6 steps, you will find identify issues – some of them severe, some minor. Then we’ll organize them using a framework to prioritize and stream work, shared by Craig Sullivan.
Allocate every finding into one of these 5 buckets:
- Test. If there is an obvious opportunity to shift behavior, expose insight or increase conversion – this bucket is where you place stuff for testing. If you have traffic and leakage, this is the bucket for that issue.
- Instrument. If an issue is placed in this bucket, it means we need to beef up the analytics reporting. This can involve fixing, adding or improving tag or event handling on the analytics configuration. We instrument both structurally and for insight in the pain points we’ve found.
- Hypothesize. This is where we’ve found a page, widget or process that’s just not working well but we don’t see a clear single solution. Since we need to really shift the behaviour at this crux point, we’ll brainstorm hypotheses. Driven by evidence and data, we’ll create test plans to find the answers to the questions and change the conversion or KPI figure in the desired direction.
- Just Do It – JFDI. This is a bucket for issues where a fix is easy to identify or the change is a no-brainer. Items marked with this flag can either be deployed in a batch or as part of a controlled test. Stuff in here requires low effort or are micro-opportunities to increase conversion and should be fixed.
- Investigate. You need to do some testing with particular devices or need more information to triangulate a problem you spotted. If an item is in this bucket, you need to ask questions or do further digging.
Next: issue scoring, ranking them.
We can’t do everything at once and hence need to prioritize. Why?
- Keeps you / client away from shiny things
- Focus is almost always on biggest money / lowest cost delivery
- Helps you achieve bigger wins earlier in projects
- Gives you / the client potential ROI figures
- Keeps the whole team grounded
Once we start optimizing, we start with high-priority items and leave low priority last – but eventually all of it should get done.There are many different ways you can go about it. A simple yet very useful way is to use a scoring system from 1 to 5 (1= minor issue, 5 = critically important).
In your report you should mark every issue with a star rating to indicate the level of opportunity (the potential lift in site conversion, revenue or use of features):
★★★★★
This rating is for a critical usability, conversion or persuasion issue that will be encountered by many visitors to the site or has high impact. Implementing fixes or testing is likely to drive significant change in conversion and revenue.
★★★★
This rating is for a critical issue that may not be viewed by all visitors or has a lesser impact.
★★★
This rating is for a major usability or conversion issue that will be encountered by many visitors to the site or has a high impact.
★★
This rating is for a major usability or conversion issue that may not be viewed by all visitors or has a lesser impact.
★
This rating is for a minor usability or conversion issue and although is low for potential revenue or conversion value, it is still worth fixing at lower priority.
There are 2 criteria that are more important than others when giving a score:
- Ease of implementation (time/complexity/risk). Sometimes the data tells you to build a feature, but it takes months to do it. So it’s not something you’d start with.
- Opportunity score (subjective opinion on how big of a lift you might get). This depends on how many users are exposed to the issue, and how close to the money the issue is. Let’s say you see that the completion rate on the checkout page is 65%. That’s a clear indicator that there’s lots of room for growth, and because this is a money page (payments taken here), any relative growth in percentages will be a lot of absolute dollars.
Essentially: follow the money. You want to start with things that will make a positive impact on your bottom line right away.
Be more analytical when assinging a score to items in Test and Hypothesize buckets.
Now create a spreadsheet with 7 columns, and add every issue you’ve identified in there. Give more weight to issues that affect a large portion of your visitors (e.g. problems on high traffic pages or in the checkout funnel).
| Issue | Bucket | Location | Background | Action | Rating | Responsible |
|---|---|---|---|---|---|---|
| Google Analytics bounce info is wrong | Instrument | Every page | Google Analytics script is loaded twice! Line 207 and 506 of the home | Remove double entry | ★★★★ | Jack |
| Missing value proposition | Hypothesize | Home page | Give reasons to buy from you | Add a prominent value proposition | ★★★ | Jill |
| Product images too small | Test | Product pages | Can’t see the product properly | Add more bigger images | ★★★ | Jill |
Note that this spreadsheet is for prioritizing issues. For prioritizing specific test hypotheses that address issues that you allocated into “test” and “hypothesize” you should use the PXL test prioritization framework.
Most conversion projects will have 15-30 pages full of issues. “What to test” is not a problem anymore, you will have more than enough.
By using this approach, you can dramatically increase the number of winning tests.
Further reading on how to run A/B tests properly:
- Stopping A/B Tests: How Many Conversions Do I Need?
- Statistical Significance Does Not Equal Validity (or Why You Get Imaginary Lifts)
- 12 A/B Split Testing Mistakes I See Businesses Make All The Time
Conclusion
Your execution velocity comprises of the number of tests run (testing volume) and how many tests will win (quality of your hypotheses). By using ResearchXL framework you will have more tests that win, and bigger impact per successful test.
Want to learn more about how to use ResearchXL framework? Download my book “Essentials of Conversion Optimization”
Related Posts
-

If you're doing it right, you probably have a large list of A/B testing ideas…
-
If you ever ran a highly trustworthy and positive a/b test, chances are that you’ll…
-

You have your CRM, web analytics, email marketing tool, payment processors, survey tools and so…
-
Do you need to be a big company and need large volumes of traffic to be data…


Great Post Peep! As usual you are full of useful information that we can work on for the coming year.
Thanks – let me know how it works out for you.
I love how you put everything together here Peep.
One thing that I haven’t put too much time into is using form analytics tools – definitely going to check out the ones you included here, thanks.
Yeah if you have forms on your website, it’s very important to have full data on each form field.
Excellent post, thanks for this workflow. I’ve used all these things seperately, but it’s good to have them in one overview.
Process ftw!
I came through Inbound and I found exactly what I’m looking for, Informative post and helpful information.
Thank you, Peep.
Great article + very useful links in it. I’ll be sure to put it on the list for Duckconvert (not the 1st one of your articles :) )
“Conversion optimization is being SEO-fied more and more: rubbish content is starting to be more widespread than high quality content “
Another great strategic post from CXL – miles away from the hit-and-hope tactical stuff typically available. Genuinely valuable. Thanks Peep.
great summary of how things work. definitely what i used after going through the course.
Great one. Most inspiring article I have read since long time. We will soon talk more. Best Götz
Brilliant article Peep. Will share with the team as summarises the process so well. Thanks again for another insightful article. Cheers, Neal
One question, it is often advocated to look into funnel data to see where most visitors drop out. e.g. 20% convert from the homepage to funnel, then 40% to step 2, and 10% finish the funnel.
How does this really help to find the biggest leak? Going by the numbers says homepage–>funnel, going by common sense says step 2 to the end of the funnel. But in reality it may not be so obvious…
What’s your view on this ?
First step is always calculating both the relative and absolute drop-off between layers of the site, so not only the funnel, but also previous layers (e.g. category page, product page etc). That’s the only way to know what’s working and what’s not. Biggest gains are to be had where you have the largest leaks.
“Even if we sell the same products to the same demographic, many things can be different – traffic sources, relationship with the audience, customer support etc. It’s almost never apples to apples.
This is also why it’s useless to copy A/B tests from sites like WhichTestWon, and hope for the same result. Stop that. Websites are highly contextual.”
Thanks Peep for sharing your hard won experience
(and often making me laugh with your take no prisoners plain talking. Never change!)
This is stuff that is not for the faint of heart.
( Note: I wish it WAS as easy as the Red or Green button tests..It is not)
It requires real work, dedication and process.
Looking forward to (one day soon) being able to do your CRO course. ;-)