“How do we get our customers to do what we want them to do?”
Digital marketers get asked this question all the time. But it’s the wrong question.
What businesses should really ask is, “How do I help my customers achieve their goals on my website while still achieving mine?” Focusing on that question is the starting point for building a customer journey map.
When it comes to your website, customer journey maps reveal exactly where your site is helping visitors succeed—or letting them down.
A customer journey map is an illustration or diagram of all the touchpoints your customers have with your company, online or off.
User journey maps allow you to understand each step customers have to go through, their interaction at each phase, and their experience when going from the first contact with your product until they become a customer—or abandon your user journey.
Why do you need a customer journey map?
Kerry Bodine, a customer experience consultant, explained the purpose of customer journey maps in a Moz Whiteboard Friday:
The goal of the customer journey map is really to get a holistic view of what the customer is going through from their point of view and really what it’s like for them on a personal level, that human level.
What does a great customer journey map look like?
Although we’ve previously looked at great customer journey mapping examples, no two journey maps are exactly the same. Depending on the customer experience expert you follow and the business (i.e. product or service) you’re mapping, the design will differ.
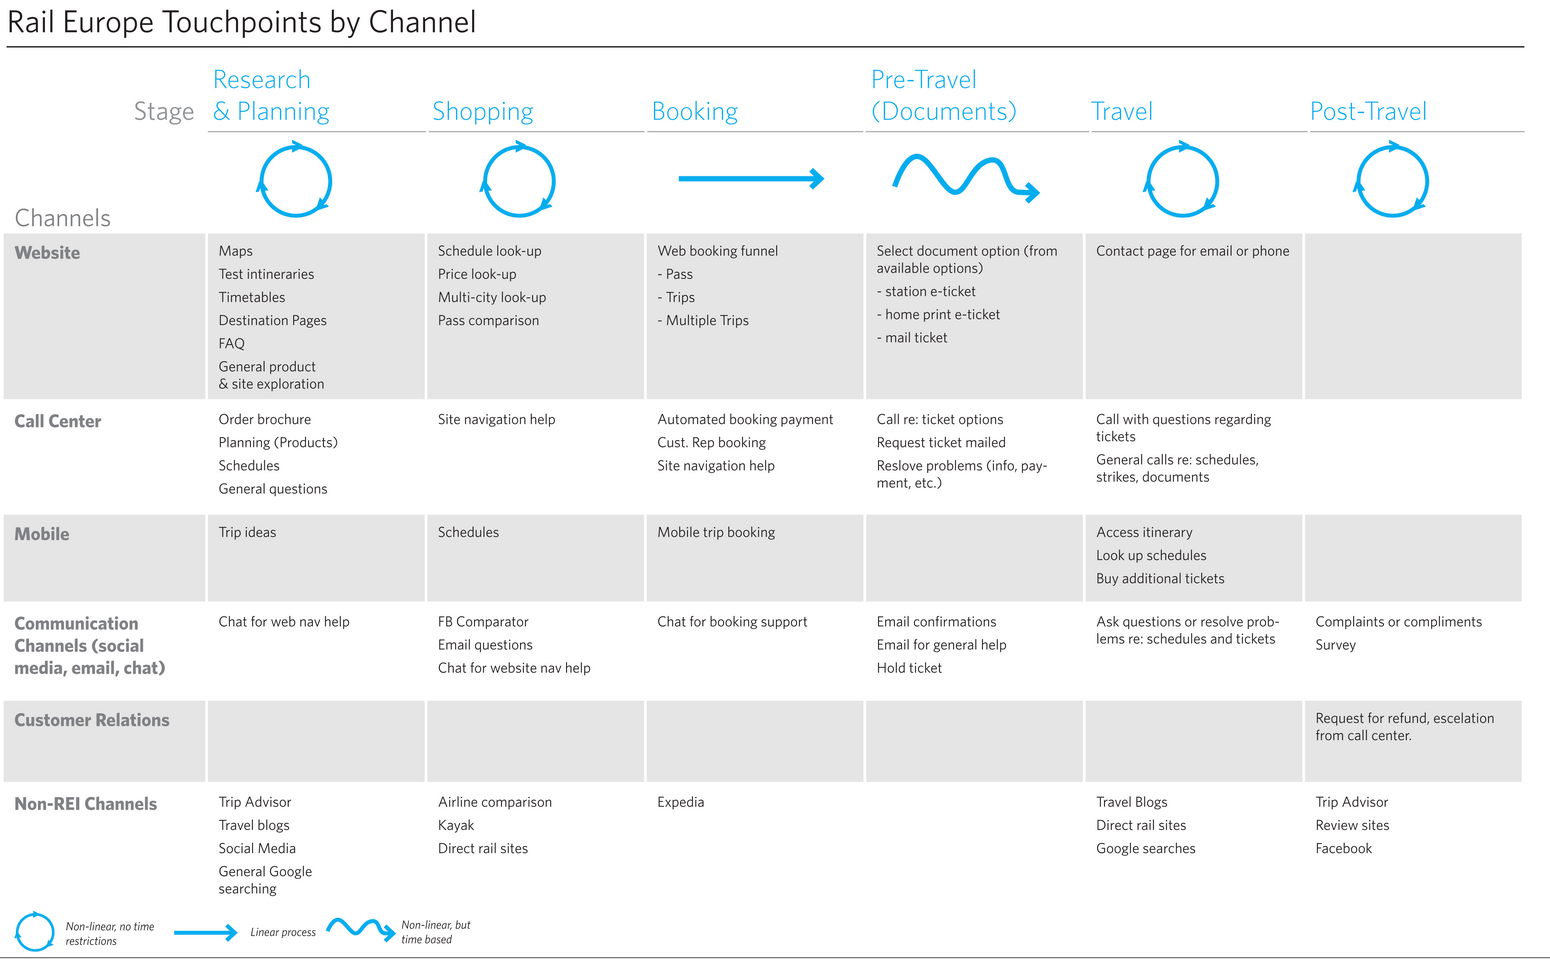
Adaptive Path, a UX/digital design agency that was acquired by Capital One, talks in terms of “experience maps.” Their visualization has two parts:
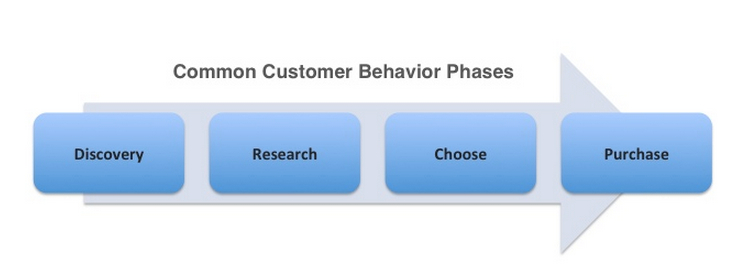
Shows how a customer moves through each phase of interaction.
As you can see above, they start the customer mapping process by defining the behavioral stages a typical customer goes through. Then, they add granularity to each touchpoint.
With that in place, they bring in their customer personas to create a “lens” through which to view the journey. Each persona can yield its own map—becoming the reference point from which they base the journey.
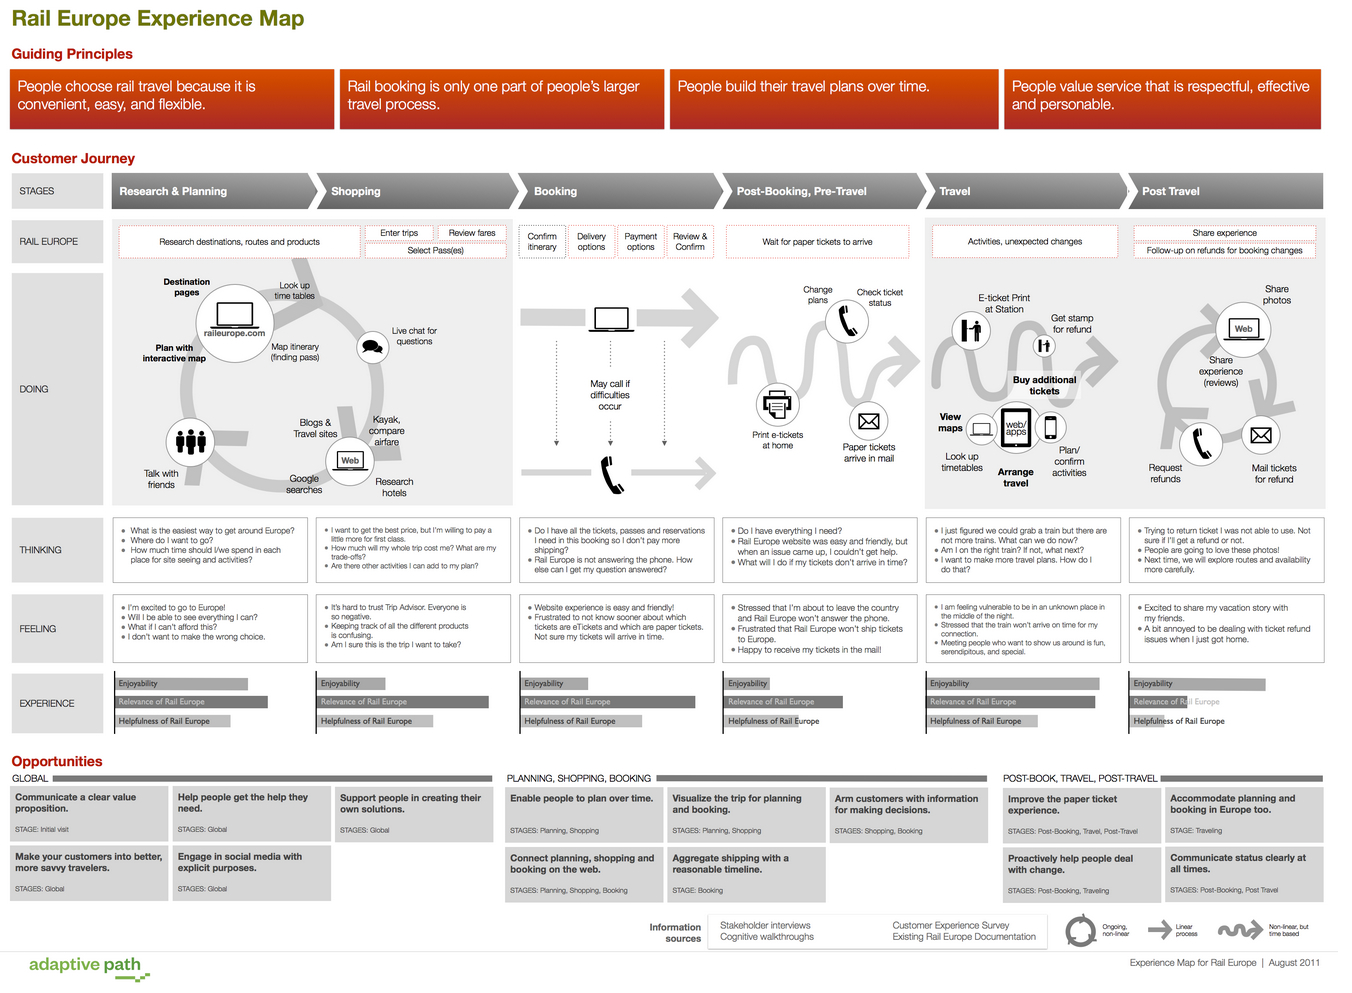
To help their client, Rail Europe, understand how North American travelers engage with the company across all touchpoints—not just when booking tickets—Adaptive Path built this customer journey map form that initial diagram:
A customer journey map helps crystallize where customers get stuck or frustrated on their path to purchase and beyond. It’s a visual representation that synthesizes data on personas and user behavior.
While journey maps can cover all interactions with a business, this post focuses on how to build a map to optimize your website. And, as the Adaptive Path example suggests, it starts with personas.
You can’t map the customer journey without data-driven personas
What motivates your customers? What are their needs, hesitations, and concerns? Knowing whom you’re talking to is the starting point. Guesses or anecdotes aren’t enough.
To build viable personas, you need data. Today, the most successful companies dig deep into their data to build personas. A decade ago, few did. Indeed, a CMO Council study from 2008 found that:
Over 50% of global marketers report that they have fair, little, or no knowledge of the customer demographic, behavioral, psychographic and transactional data. Just 6% say they have excellent knowledge of the customer.
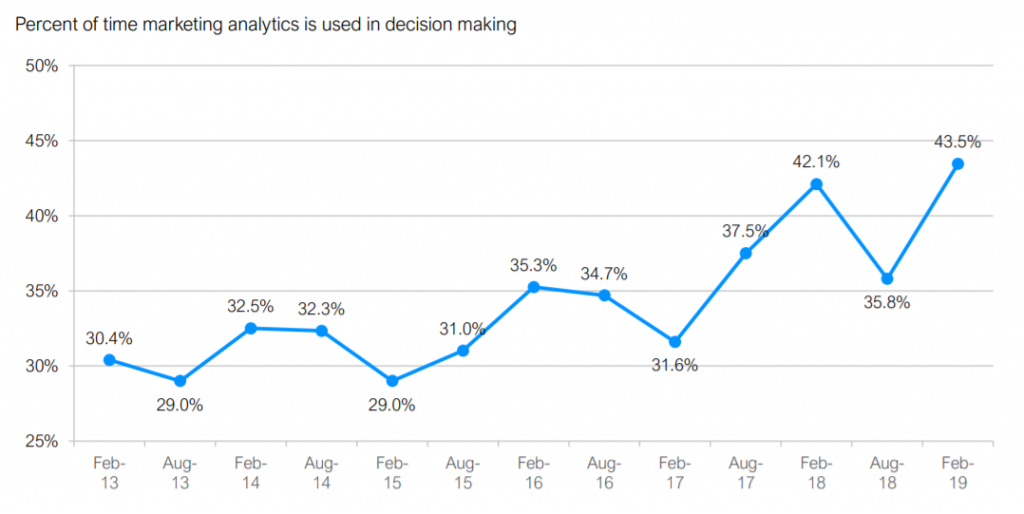
By 2019, according to the CMO Survey, the trend toward data-driven decision-making had shifted. Still, marketing data is used in decision-making less than half the time:
If you haven’t yet created data-driven personas for your business, take a look at these posts. Each will help you build a customer persona based on research, not conjecture:
Or, go in-depth with a full course. Once you have your personas, you can combine that data with an in-depth look at user behavior on your website. The outcome will be your customer journey map.
How to create a customer journey map
Here is a process to create an effective user journey map in 5 steps:
Depending on your business, customers may go through different stages while navigating your site. A B2C ecommerce company may have just a few clearly defined phases; a B2B SaaS company selling to the Fortune 100 may have more.
Your personas should give you a pretty good idea of the process that customers go through from their first landing to an eventual purchase and subsequent interactions.
The next step identifies which interactions fit into which stages.
Step 2: Align customer goals with each stage.
This may be the most critical—and, in some cases, most difficult—step when creating a customer journey map.
What do customers want to achieve as they move through each behavioral stage? You can mine a number of data sources to get that information:
Then, you’ll be able to see if your website supports each of those goals.
Step 3: Plot the touchpoints.
Think of touchpoints as places where customers engage with your site and where you support the completion of their goals. These touchpoints will be grouped under the relevant stage in your customer’s journey.
For retailers, a common touchpoint might be a product description page; for a service business, it may anything from a pricing page to a contact form.
You can identify touchpoints along the user journey in two reports in Google Analytics:
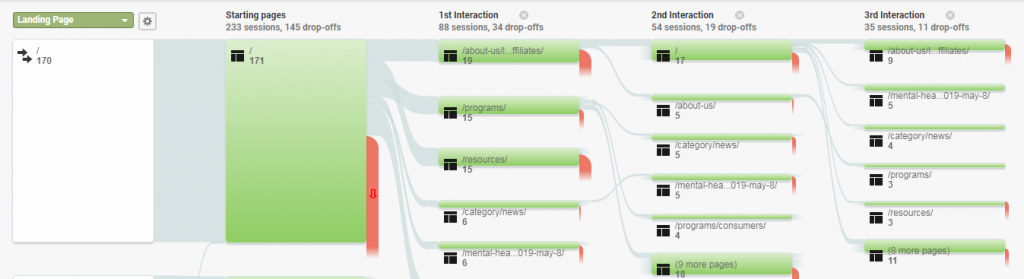
The Behavior Flow report shows how users move from one page or event to the next. It can help show you where users struggle to get where they want to go on your site.
You can segment traffic by any dimension, then analyze specific steps in the flow by mousing over them.
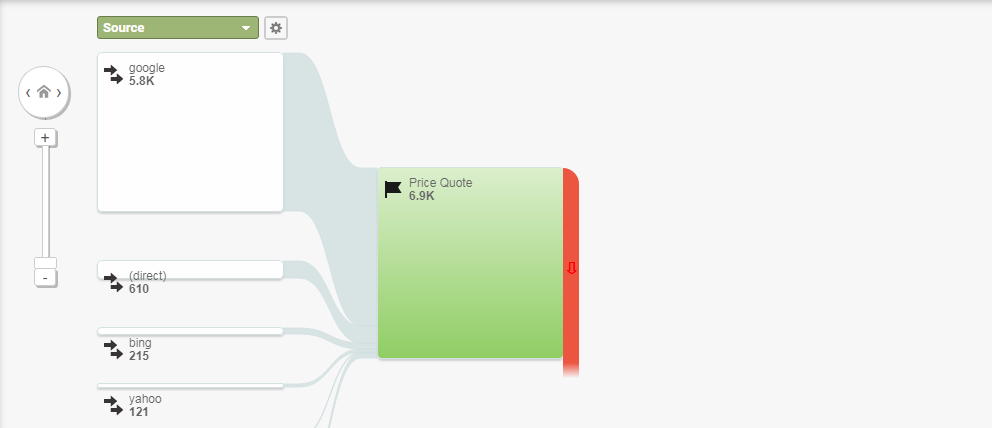
2. Goal Flow report
The Goal Flow report helps you see whether users are completing a goal of your choosing through a funnel.
You’ll be able to determine if users—or a subset of them—are unexpectedly leaving in the middle of their journey on the path to the goal, or if there’s a place where your traffic loops back.
If you’re new to Google Analytics, you can learn more about how to interpret your data, especially as it relates to conversion flows:
Step 4: Determine if customers achieve their goals.
This is where you take the data you’ve collected and measure it against how easily your customers can get done what they need to do. Ask yourself the following types of questions:
Where are there roadblocks?
Do tons of people abandon their carts on the checkout page?
Do users go to your opt-in download page but not fill out the form?
The Google Analytics reports you’ve mined for insights will show you where issues crop up. The existing qualitative research you have—the same research you used to build your personas—should help you understand the why behind the problems.
Analyze the actions (or lack thereof) of your customers. How well are their needs met at each touchpoint and during each phase?
For instance, if research suggests that customers worry about getting locked into a particular plan after they sign up, tweaking your copy on a relevant page could alleviate their hesitations.
If you want to learn more about testing or our research and prioritization frameworks, see these posts:
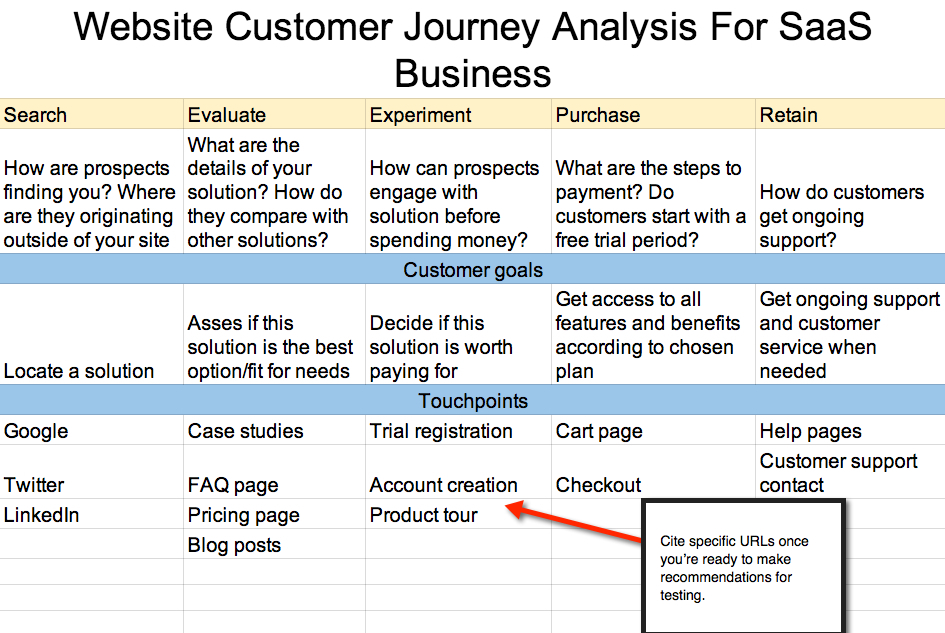
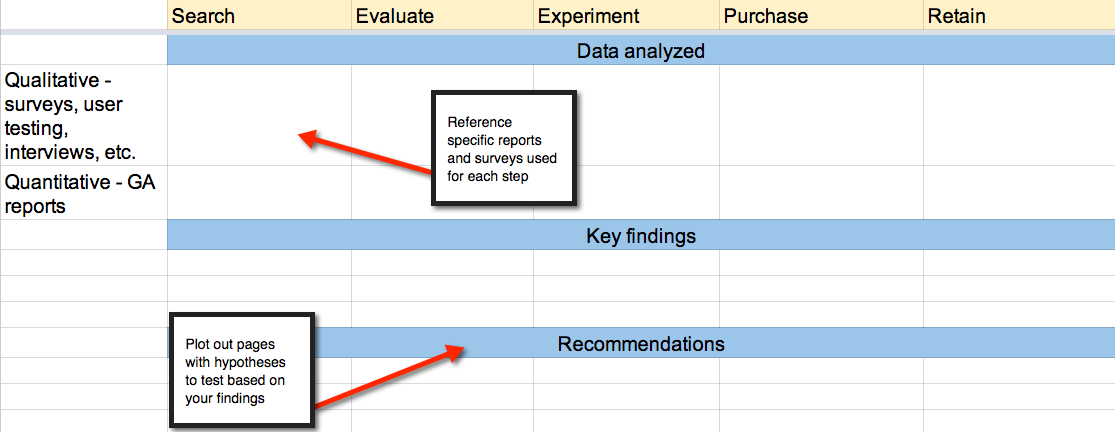
Spreadsheets may not be sexy, but they’re ideal for organizing data. Your customer journey map doesn’t need to be complicated—or beautiful.
Remember: It’s a tool to help you understand how users interact with your site, where they get stuck, and how to improve trouble spots.
Above is an example I put together to represent the journey a customer may go through with a SaaS company. Each stage has a corresponding customer goal, along with the relevant touchpoints.
Keep track of the reports and surveys you reference, along with the stages they illuminate:
Get as granular as you like. Add annotations where you find that customers seem to miss steps or loop back. Then, add your analysis of the journey under “Key Findings” and the hypotheses to test under “Recommendations.”
Case study: How improving the customer journey lifted more than just the bottom line
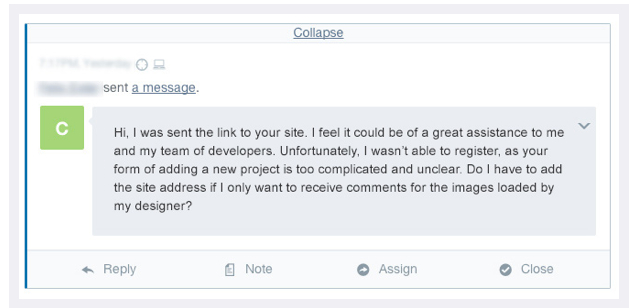
The guys at TrackDuck, a SaaS company with an web-based tool for feedback and bug tracking, gleaned insights from customer comments to improve registrations.
They recognized that users had difficulty registering. They reduced the 10-step registration to a four-step process—increasing registration completions by 120%.
TrackDuck realized that their qualitative data could improve revenue and set their customers up for success at the same time.
If you are working on an app for developers, be ready for a high bounce rate at the user-registration stage. Converting a visitor into a customer is really difficult. To achieve this, it’s essential that the visitor figures out how your app works in the first 3–5 minutes.
How your customers interact with your website or your brand isn’t a linear process—no matter how much you might want it to be. Getting people to move from Point A to Point B without jumping ship or missing a step doesn’t always happen.
But taking the time to understand as much as you can about your customers’ goals—and how they move through your website—can go a long way toward keeping them happy. It will also grow your business.
There is one variable that data is not very good at deciphering - the human.…
Jennifer Havice
Jen Havice is a Twin Cities website copywriter who specializes in creating content with personality that's made for conversions. She runs Make Mention where she helps small businesses and entrepreneurs create better performing websites with better copy. Connect with her on Twitter @jenhavice
Join the conversation Add your comment
Janice
Excellent post. Thanks for sharing!
Jen
So glad you liked it!
Touchpoint Dashboard
Great post and resource for journey mappers! I applaud how you call out that rather than looking for a quick fix, businesses should be asking “How do I help my customers achieve their goals while still achieving mine?” You nailed it! And that’s exactly what a journey map can do — it’s such a powerful tool!
You pointed your readers to a lot of helpful mapping resources, and I’d like to recommend another — it’s Touchpoint Dashboard’s Guide to Journey Mapping. It provides mapping theory and outlines the steps for creating a data-driven, insightful maps. Here’s the link: http://bit.ly/1pg5kxE (free download)
Thanks again for the awesome post!
Jennifer
TouchpointDashboard.com
Jen
Thanks for the kind words and I’m glad you enjoyed the article. I’ll stop on over and check out your guide!
Michael
Brilliant post. Much appreciated.
Thank you
Yuri
Hey Jen,
Thank you for your article and for such detailed explanation!
Your article was one of those that inspired us to create UXPressia!
UXpressia (http://uxpressia.com), a web application that allows to create appealing and easy to support Customer Journey Maps (Experience Maps). Unlike some alternatives (sticky notes, Excel, Photoshop), our product is friendly to users who is novice in service design field by providing meaningful defaults, real map examples, tips on discovering problems and improving services and help. Besides it gives more beautiful output to present clients and team without making user invest their time in graphic design.
If you have enough time to test our product I would love to hear your feedback on it!
Subbu Jois
Excellent piece!
Edward Smith
You pointed very well these 5 steps to build a customer journey map. Customer journey mapping ( https://www.ecrion.com/customer-journey-mapping ) is now a mandatory part of more complex customer communications solutions. When you map out your ideal customer journey with a next-gen solution such as Ecrion’s, you get a 360-degree view of the customer and a clear picture of the customer experience in real-time, as they interact with your business.
Comments are closed.
Current article:
Customer journey maps: a step-by-step guide to mapping user journey


Excellent post. Thanks for sharing!
So glad you liked it!
Great post and resource for journey mappers! I applaud how you call out that rather than looking for a quick fix, businesses should be asking “How do I help my customers achieve their goals while still achieving mine?” You nailed it! And that’s exactly what a journey map can do — it’s such a powerful tool!
You pointed your readers to a lot of helpful mapping resources, and I’d like to recommend another — it’s Touchpoint Dashboard’s Guide to Journey Mapping. It provides mapping theory and outlines the steps for creating a data-driven, insightful maps. Here’s the link: http://bit.ly/1pg5kxE (free download)
Thanks again for the awesome post!
Jennifer
TouchpointDashboard.com
Thanks for the kind words and I’m glad you enjoyed the article. I’ll stop on over and check out your guide!
Brilliant post. Much appreciated.
Thank you
Hey Jen,
Thank you for your article and for such detailed explanation!
Your article was one of those that inspired us to create UXPressia!
UXpressia (http://uxpressia.com), a web application that allows to create appealing and easy to support Customer Journey Maps (Experience Maps). Unlike some alternatives (sticky notes, Excel, Photoshop), our product is friendly to users who is novice in service design field by providing meaningful defaults, real map examples, tips on discovering problems and improving services and help. Besides it gives more beautiful output to present clients and team without making user invest their time in graphic design.
If you have enough time to test our product I would love to hear your feedback on it!
Excellent piece!
You pointed very well these 5 steps to build a customer journey map. Customer journey mapping ( https://www.ecrion.com/customer-journey-mapping ) is now a mandatory part of more complex customer communications solutions. When you map out your ideal customer journey with a next-gen solution such as Ecrion’s, you get a 360-degree view of the customer and a clear picture of the customer experience in real-time, as they interact with your business.