Mediocre brands guess: “It seems like our latest run of Facebook ads is working well.”
Top-tier brands know: “Our current Facebook ad set is driving traffic, but it’s our retargeting pixel that’s converting customers.”
It’s the data-driven understanding of what works—and what doesn’t— that separates sophisticated marketers from the pack.
Marketing attribution models help marketers assess the data behind user touchpoints and conversions to understand the impact on ROI.
In this article, you’ll learn how marketing attribution works, how it can be measured with six different models, and how to make data-driven decisions that improve your marketing budget.
Table of contents
- What is marketing attribution and why does it matter?
- How to measure marketing attribution
- Challenges and limitations of marketing attribution
- Using custom attribution modeling for advanced attribution
- How to use marketing attribution to make stronger data-driven decisions
- Marketing attribution tools: How to choose the right one for your business
- Conclusion
What is marketing attribution and why does it matter?
Marketing attribution is the practice of analyzing how customers engage with marketing touchpoints throughout their buying journey.
You choose an attribution model (a set of rules that governs how you attribute conversion credit to each touchpoint) to understand how your marketing tactics contribute toward revenue growth.
Marketing attribution provides the data that backs insights like:
- Our Google Ads are our most significant revenue driver.
- This email nurture campaign is ineffective and needs rebuilding.
- Most of our customers discover us through our organic content.
Without this data, marketing decisions are largely based on intuition.
Say you’re tasked with the challenge of boosting lead generation by 25% for the next quarter, in pursuit of closing out your organization’s revenue goals for the year.
Marketing attribution data can show you, for example, that your organic content is the most common first touchpoint in your typical customer’s journey. In other words, content is how most customers find your company.
Without this data, you might look at the marketing channels and tactics you have in play right now and say, “Let’s reallocate the content budget this quarter to Google Ads. We need to make a run at this revenue goal.”
In this instance, deprioritizing content publishing efforts is the wrong move, but one you could easily make if you don’t have access to attribution data.
How effective these insights depend on how you measure marketing attribution.
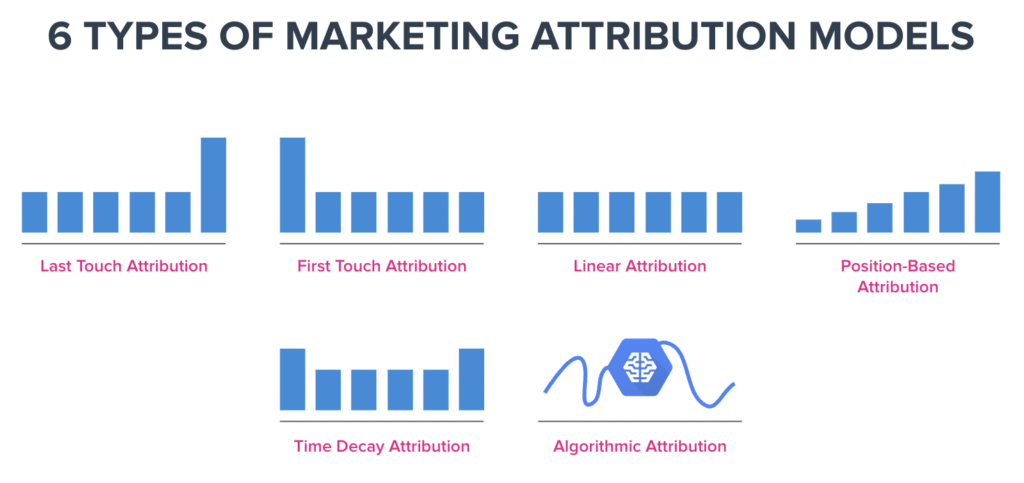
How to measure marketing attribution
Most marketers will use one of the out-of-the-box models in their attribution software. Though these have flaws (which we’ll discuss shortly), they do provide a baseline understanding of how customers interact with marketing touchpoints.
Single-touch attribution models
Single-touch attribution models give credit to only one touchpoint in the customer journey.
The drawback here is immediately obvious: customers rarely convert off the back of a single touchpoint.
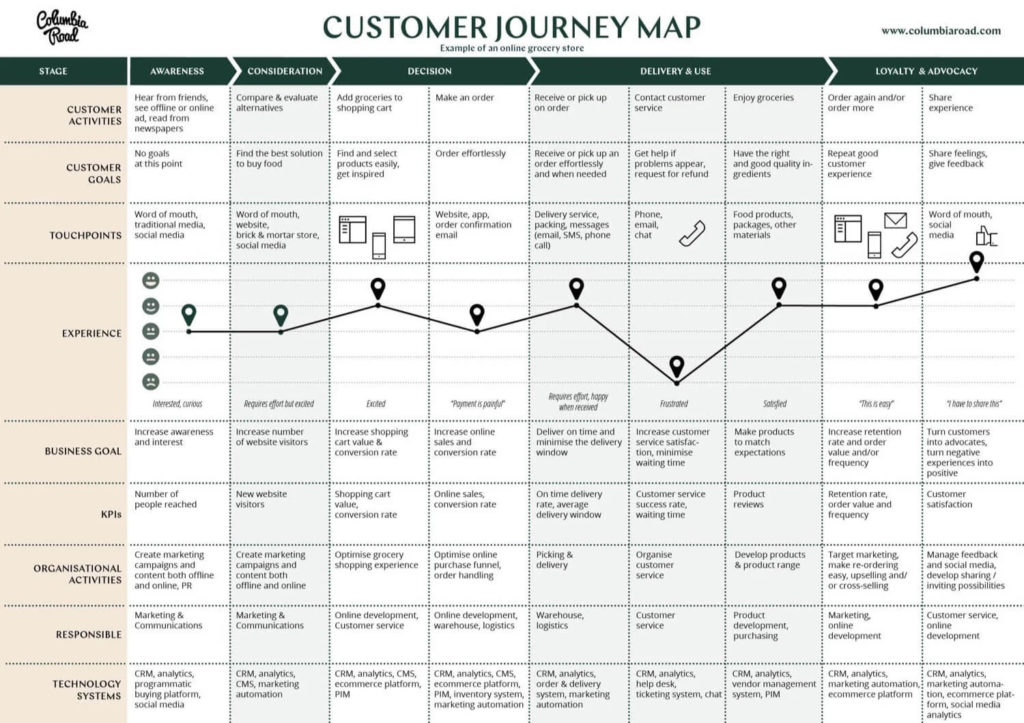
Consider this customer journey map from digital sales consultancy Columbia Road, with 10 touchpoints en route to a decision.
However, there is some merit in these simple attribution models. Consider this customer journey, which approximates the typical path customers take to purchasing from an ecommerce brand:
- A customer comes to your website via a Google Ad
- They add a product to their cart, but don’t convert
- This triggers an abandoned cart email, which the customer sees but doesn’t click on
- The customer also sees retargeting ads on Facebook, one of which triggers a purchase
At face value, the Facebook ad is entirely responsible for conversion.
But the first-touch attribution model highlights the Google Ad catalyst.
Single-touch attribution models may not be comprehensive, but they do help you understand how the touchpoints piece together to give you a better indication of what is working.
First-touch attribution
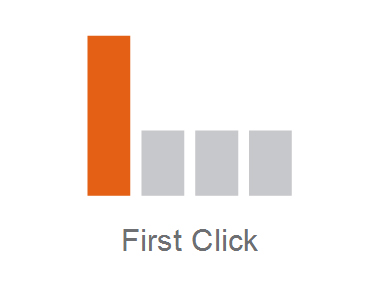
First-touch attribution gives all credit to the first interaction a customer has with your brand.
It doesn’t matter how many touchpoints came thereafter, or how long it took for the customer to buy after that first interaction. The first click gets 100% of the credit.
In the above example, the initial Google Ad receives all the attribution credit.
Though limited, this attribution model is useful for understanding which marketing activities attract customers.
You can use that data to optimize top of funnel activities and drive more new leads.
Last-touch attribution
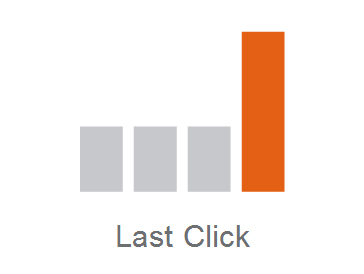
Last-touch attribution gives all credit to the final touchpoint in the customer journey. This would be the retargeting Facebook ad from our example above.
It’s the most widely used single-touch attribution model, especially for businesses with short buying cycles and consideration stages. In those cases, the last interaction is more likely to have motivated the purchase.
Take Wish, an online marketplace known for selling strange products you’d never think to buy otherwise. It probably doesn’t have elaborate customer journeys, so last-touch attribution would be an appropriate model.

Last non-direct click attribution
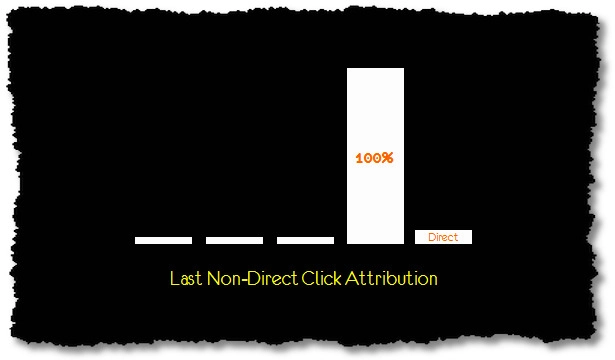
The last non-direct click attribution model is similar to the last-touch model, except it discounts direct traffic.
Let’s consider a slightly different ecommerce buying journey:
- A customer comes to your website via a Google Ad
- They add a product to their cart, but don’t convert
- This triggers an abandoned cart email, which the customer sees but doesn’t click on
- Later, the customer comes back to your site directly and purchases
Under the last-click attribution model it would go to direct traffic. Using the last non-direct interaction model, the cart recovery email gets all of the credit.
This model is appropriate if customers convert quickly once on your site (e.g. they add the product they want to their cart and head straight to checkout).
Avoid this model if your customers take longer to convert because it ignores influencing factors (like CTAs and featured customer reviews) in conversion.
Multi-touch attribution models
Multi-touch attribution models take into account all digital touchpoints and assign at least some conversion rate credit to each interaction.
Consider the pathway a B2B buyer might take to purchase a project management platform.
The customer sees a product ad for Asana on YouTube and clicks the CTA. They read through the landing page, but don’t convert.
Pondering the problem presented in the video ad (e.g. managing a team of freelancers), the customer performs a Google search for “managing freelancers.” The customer clicks on Asana’s post, recognizing the brand.

It’s helpful, and they decide to implement a few strategies. Later, they see an ad for Asana on LinkedIn and click on the CTA to download an ebook.
Next, they receive a series of Asana lead nurture emails. The last is an offer for their first month free when they sign up for an annual plan, which they accept.
In this journey, there are six distinct digital marketing channels involved:
- YouTube ad
- Landing page
- Organic content
- LinkedIn ad
- Ebook
- Email nurture campaign
Single-touch attribution models would by nature ignore five out of six of these interactions. Multi-touch models share attribution credit across all channels, though how the credit is distributed depends on the model you implement.
Linear attribution
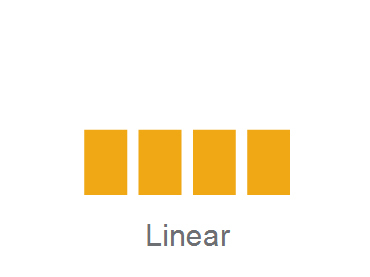
The linear attribution model assigns credit evenly across all touchpoints. In the above example, each of the six touchpoints would receive 16.67% of the attribution credit.
This model is suitable if you don’t have the budget or data to determine more accurate weightings, but can’t settle for single-touch model limitations.
If you’re an established company with ample resources, invest in more accurate determinations.
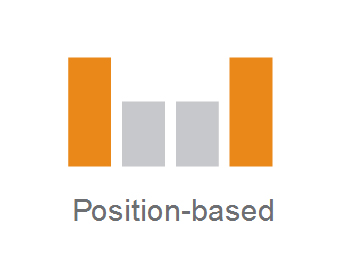
Position-based attribution

Position-based attribution (also called U-shaped attribution) gives more weight to the first and last interactions. Still, it assigns some credit to the touchpoints in between.
The most common model is to assign 40% each to the first and last touchpoints, with the remaining 20% spread evenly across the rest.
In our above example, credit distribution would look like this:
- YouTube ad – 40%
- Landing page – 5%
- Organic content – 5%
- LinkedIn ad – 5%
- Ebook – 5%
- Email nurture campaign – 40%
Position-based attribution is useful if your sales cycle is long and there are several touchpoints involved in a purchase decision, such as in B2B buying. For long buying cycles, it’s important to give at least some credit to each interaction that kept the conversation alive.
Time decay attribution
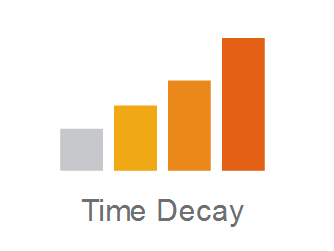
The time decay attribution model distributes credit based on how much time has passed since the interaction.
The final touchpoint always receives the most credit, and the first touchpoint receives the least.
In our Asana example, the credit distribution might look like this:
- YouTube ad – 5%
- Landing page – 7.5%
- Organic content – 12.5%
- LinkedIn ad – 20%
- Ebook – 25%
- Email nurture campaign – 30%
Time-decay models are useful when relationship-building is a key factor, such as in enterprise sales, as the initial interactions tend to be less important to conversion.
If brand building and awareness channels are critical to your business goals, however, use the position-based model.
Challenges and limitations of marketing attribution
While attribution models help marketers gain a baseline understanding of customer behavior, they’re imperfect and incomplete. They’re limited to capturing, rather than creating, demand.
Most traditional models fall short because they’re based on guesswork or completely miss dark funnel activities.
Sophisticated attribution models outperform basic ones, but keep these limitations in mind before choosing a direction.
Attribution model choice is largely arbitrary
Choosing an attribution model is largely based on intuition, not hard data.
For instance, you might choose the positioned-based attribution model if it seems reasonable to assign the most credit to the first and last touchpoints.
But why does each deserve 40%? Why not 30% for the first interaction and 50% for the last, or vice versa? The credit distribution is based on gut feelings, not hard data.
The ideal solution is to implement a data-driven or algorithmic attribution model using a platform like Impact.com or Google Analytics 360.
These modeling tools use advanced statistical calculations and machine learning to understand the differences between customers who convert, and those who don’t. Then, interpret those engagement patterns to determine how to attribute credit across touchpoints effectively.
Unfortunately, these products are prohibitively expensive for some businesses (Google Analytics 360 memberships start at $150,000 per year).
If this level of attribution modeling is out of reach, the best path is to:
- Choose the standard attribution model that makes the most sense for your strategy
- Optimize and customize it as you learn more about what works and what doesn’t
- Understand the limitations of non-algorithmic attribution when using insights to inform marketing decisions
Most attribution models don’t account for non-digital touchpoints
All of the attribution models discussed above cater to digital touchpoints, but buying journeys are not purely digital.
This is especially true in retail industries like clothing and apparel, where two distinct buying patterns are emerging in addition to the standard online vs. offline approaches:
- ROPO (research online, purchase offline). Buyers go through the majority of the funnel online but then complete their purchase in a physical store.
- Showrooming. Buyers examine products in physical stores but then purchase them online.
In either case, fully-digital attribution models don’t account for all touchpoints.
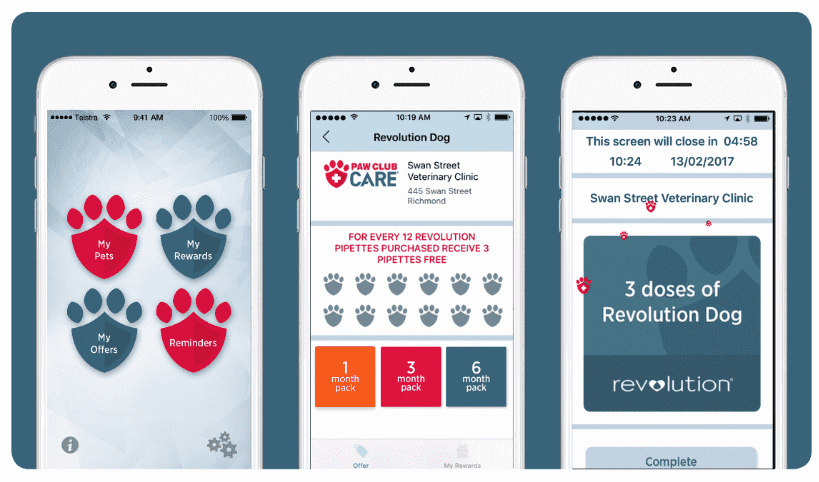
Finding a complete solution to this challenge is difficult. One strategy is to use loyalty cards to connect offline purchases with digital profiles.
Platforms like Yotpo and Stampme allow brands to integrate loyalty programs so they can effectively track offline touchpoints.
Another tactic is to purposefully lead customers offline, like furniture and decorations producer VOX.
Their VOXBOX application lets customers design virtual furniture layouts online. Then, they recommend buyers schedule in-person consultations at a physical store.

This lets VOX control the buying journey’s transition from online to offline, allowing them to integrate the offline touchpoints into their attribution model.
If appropriate to your brand and industry, consider implementing one of these strategies to track offline interactions. Otherwise, bear in mind that a digital-only attribution model may not capture the full picture.
Accounting for customers that are already in the market is challenging
Marketing attribution models often lead to correlation-based biases, where events in the customer journey (e.g. conversion) are assumed to be caused by another (e.g. the final touchpoint). In reality, this might not be the case.
In particular, marketers may improperly assign conversion attribution to customers that were in the market to buy that product anyway.
Consider this targeted Facebook ad from Shopify.
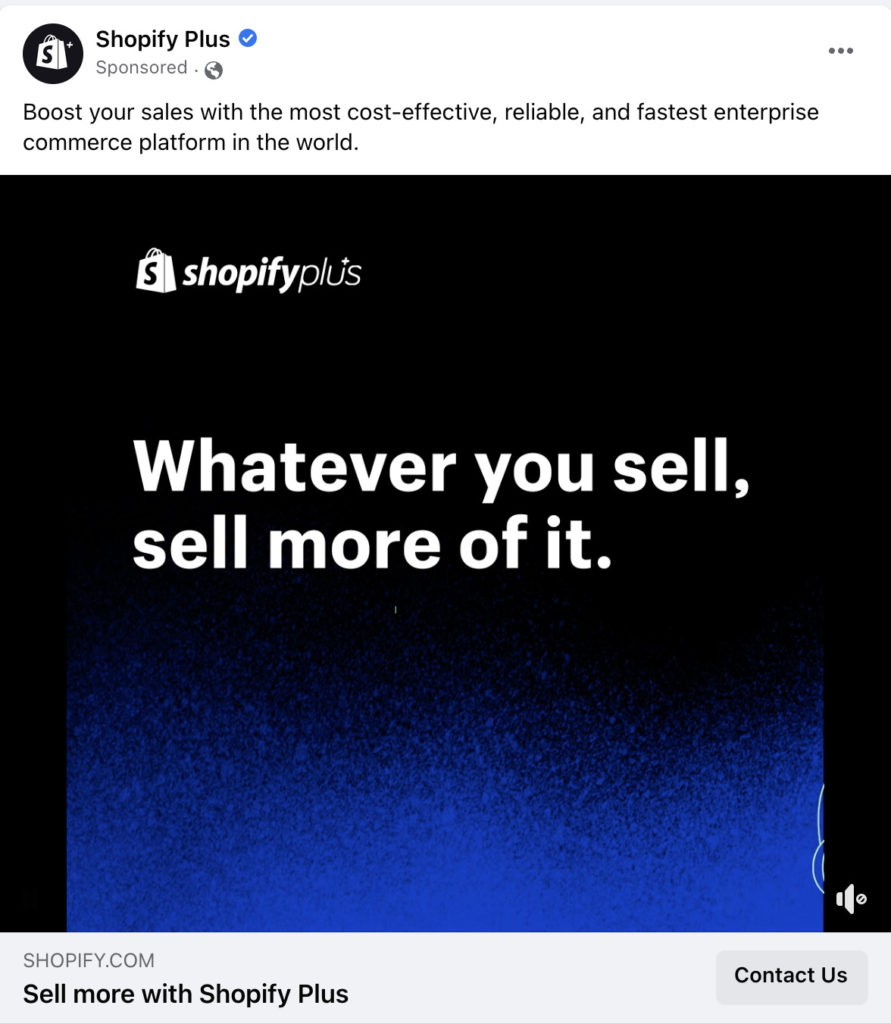
Say that Shopify set up this ad to target an audience that engages with specific ecommerce-related pages on Facebook.
The audience engages with these pages and frequently discusses the best tools on the market. There’s a strong chance they’ve determined that Shopify is the right choice before the ad pops up.
So when they see and click it, is it responsible for the conversion?
Account for in-market bias by conducting post-purchase surveys. Go beyond asking “How did you hear about us?” and ask, “What made you decide to purchase from us?”
For more qualitative data, include a question like, “Before signing up for Shopify, you clicked on this Facebook ad. How much did this ad influence your purchase?” Have customers rate responses on a 1–5 scale. This helps you gain a better understanding of whether your ads truly influence conversion, or just sit in the way of a purchase that’s going to take place anyway.
Using custom attribution modeling for advanced attribution
The above models are baseline attribution models—simple heuristic-based and out-of-the-box models found in Google Analytics. They all give you an answer, but top marketers will question their accuracy.
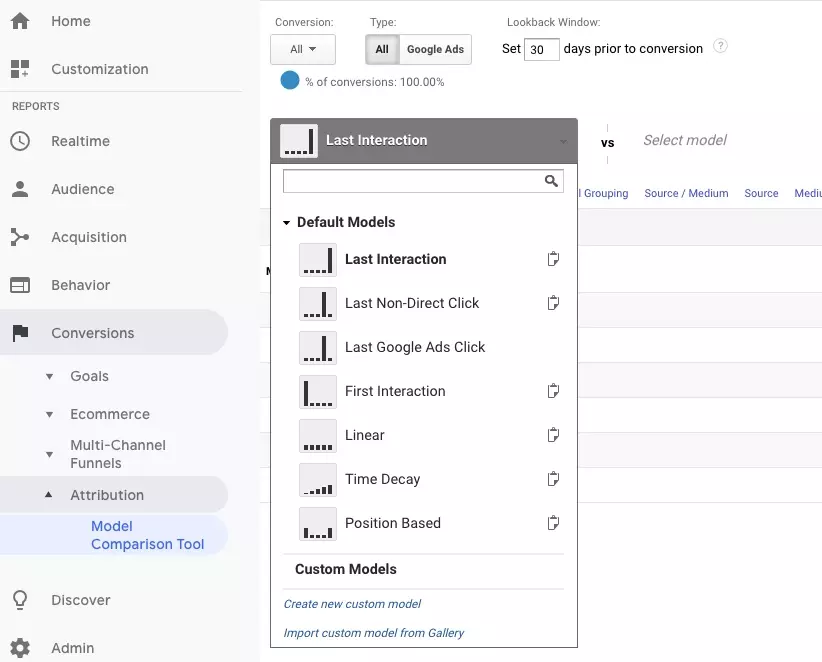
You can also build out custom models on top of the out-of-the-box rule-based models in Google Analytics.
You can also build out custom models on top of the out-of-the-box rule-based models in Google Analytics.
However, even custom models risk leaning into bias and assumptions, which are arbitrary and based on the nuances of your customer journey.
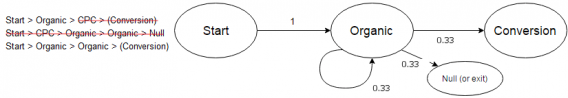
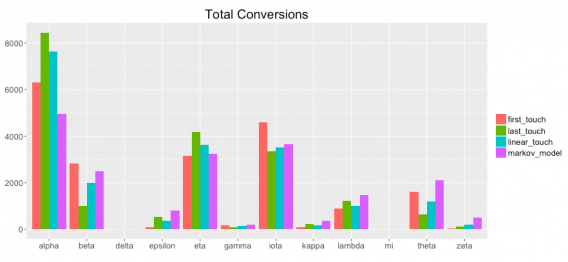
We’ve also seen some interesting articles on applying Markov Models within Google Analytics. These are helpful when you’re dissatisfied with the models outlined above, especially if you’re lacking certain datapoints to get a complete picture of your customer journey.
To simplify the Markov Model in this use case, look at the likelihood of the next steps in a given conversion path. Calculate the relative importance of a given touchpoint based on its removal:
The Markov Models has the following benefits, as outlined in this paper:
- Objectivity – No gut feelings.
- Predictive Accuracy – Predicts conversion events.
- Robustness – Valid and reliable results.
- Interpretability – Transparent and relatively easy to interpret.
- Versatility – Not dataset dependent. Able to adapt to new data.
- Algorithmic Efficiency – Provides timely results.
Here’s a good post explaining how to do that. Here’s another. A good data analyst will be capable of applying this to your attribution model.
Measure the effectiveness of specific actions using cohorts
Time-based cohorts can hold the key to finding the effectiveness of changes made to marketing activity or the channels they’re deployed on. At the very least, you can find an indication of effectiveness by combining cohort analysis with controlled experiments for greater validity.
Specifically, looking at cohorts can help you determine how effective a certain marketing action was, at least correlatively. Jim Novo, founder of The Drilling Down Project, put it well on a Digital Analytics Podcast episode:
I think the people in SaaS working with cohort analysis are doing this well.
So you look at the people that signed up in January, and by the time we got to March this percentage dropped out. We can associate that with a certain promotional effort we did in that time frame.
But then we look at the cohort that started in March, we had a different kind of promotional effort going on, and we had much better conversion from freemium to paid, or whatever, in that model.
Related to this is a type of existence testing where you infer the effectiveness of a certain channel by dropping it out of the mix for a bit, Jim suggests testing to see if you can live without it:
If you think [display] is so valuable in terms of helping other campaigns, why don’t you just kill it for a week or two weeks and see what happens? And then add it back.
Can’t you do that kind of testing? Is it worth it to you to invest that money elsewhere? How serious are you about figuring out the value of display?
The activity you’ve always done might not be making as big an impact as you believe. Testing is as much the art of removal as it is addition. This goes for cutting out entire initiatives altogether.
How to use marketing attribution to make stronger data-driven decisions
Attribution models exist to improve visibility and insights into the customer journey. Done right, they lift the veil on how customers interact with touchpoints and what influences purchasing behavior.
Feed these findings into your marketing efforts to develop a more effective, data-driven strategy.
Build more realistic customer journey maps
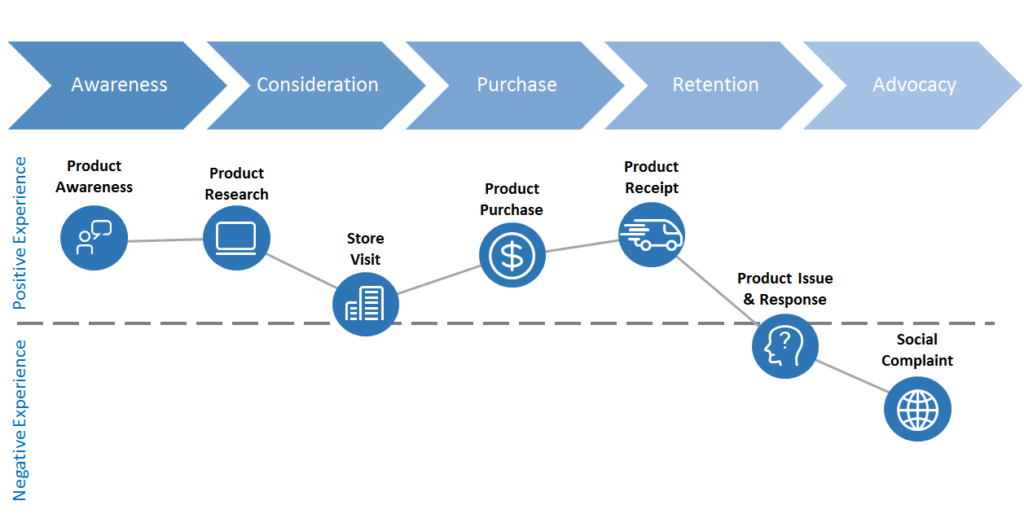
Customer journey maps can be powerful tools for aligning touchpoints and messaging across the buying cycle.
Unfortunately, many of them are too basic to be all that helpful. This map, for instance, barely covers more than one potential touchpoint at each stage, and doesn’t go into enough detail. For instance, where does the product research take place?
By understanding which touchpoints customers engage with and at what point in their journey, you’re able to build a comprehensive journey map, like this one from Rail Europe.
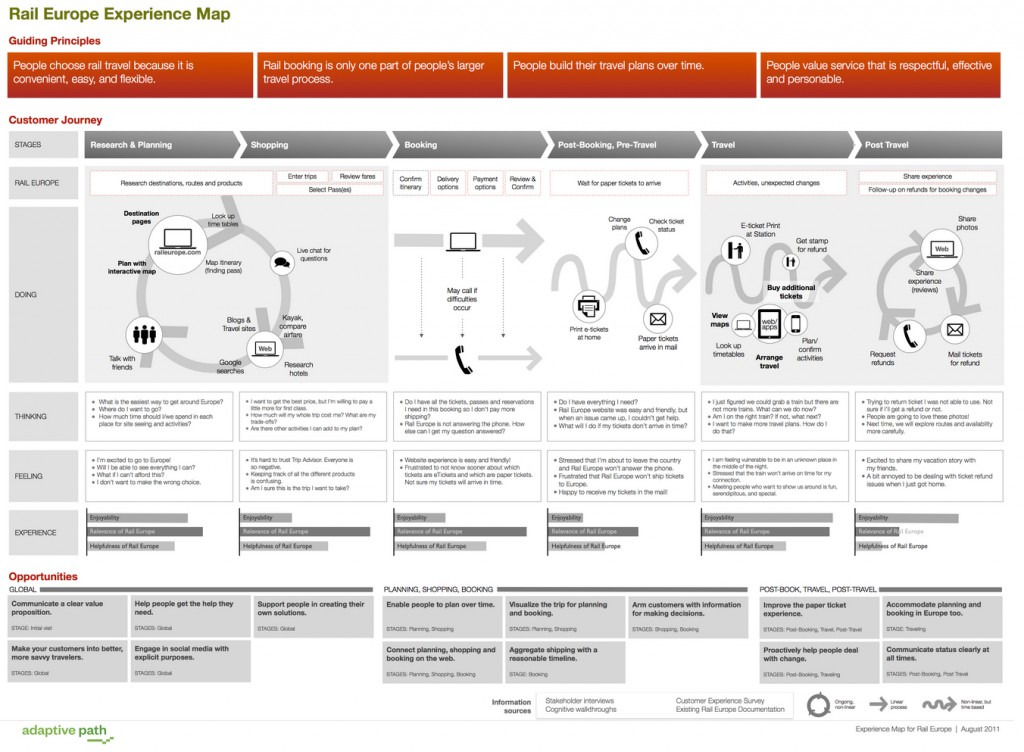
In this customer journey map, multiple touchpoints exist for each stage because not every customer experience is alike. Rail Europe accounts for this dissimilarity and incorporates all possible touchpoints identified through attribution. Custom attribution helps map complex customer interactions and journeys.
Use your attribution data to build more realistic customer journey maps, and consider where segmentation might be required.
For instance, an ecommerce brand might identify two common pathways to purchase:
- Targeted ad on Facebook > Website browse > Add product to cart > Bounce > Abandoned cart recovery email > Conversion
- Organic search > Website browse > Sign up for loyalty membership > Bounce > Buy in store
Look for trends across attribution data, and segment customer journeys if appropriate.
Use marketing attribution to align spend allocation with organizational goals
Use marketing attribution to inform how you invest in different channels and touchpoints, and optimize budget allocation using real-world data.
Double down on the activities that your analytics suite dubs the most influential. For example, if your attribution platform tells you that Google Ads perform well, it would make sense to increase investment in this channel.
Remember that your attribution model and credit allocation drive these insights.
Say, in this example, you’re using a first-touch attribution model.
What this data tells you is that your Google Ads are performing well as an initial interaction, but aren’t necessarily doing any heavy lifting when it comes to conversion. Doubling down on ad spend would drive more prospects to the top of the funnel, but not necessarily convert them any more effectively.
Instead, analyze multiple attribution models to gain a 360-degree perspective, then use these insights to align spend allocation with your company goals.
In this instance, you might also analyze what attribution looks like using the last-touch model, giving insight into which channels are working well at the other end of the journey.
Then, adjust spend based on your company goals. If new customer acquisition is a priority, invest more heavily in the last-touch interaction. If building brand awareness and top-of-funnel momentum are more critical, invest in the first touchpoint.
Understand the impact of messaging on touchpoint effectiveness
The general assumption with marketing attribution is that if one channel isn’t performing as well as others, that channel is to blame. Your customers simply aren’t on LinkedIn, you say.
But that’s not necessarily true. It could be, for instance, that your customers are there but your messaging isn’t connecting.
Marketing attribution can be used to understand how different messaging impacts touchpoint effectiveness.
Say your Facebook retargeting ads are converting exceptionally well, but your LinkedIn ads are underperforming. Consider the messaging you’re using within the context it’s presented.
What works for one channel won’t necessarily translate to another, and messaging that resonates with top-of-funnel prospects won’t get bottom-of-funnel buyers across the line.
Use different attribution models to measure the messaging impact at different funnel stages.
For example, if Google Ads look strong under the first-touch model, consider how you might replicate this messaging across other channels to target early-stage buyers. Then, analyze how attribution credit shifts as these changes come into play.
You might use the same message from a Google Ad in a new run of LinkedIn ads to test the impact of this messaging on the channel.
If attribution credit shifts in favor of LinkedIn, the change is working. If not, you’ve learned that this particular message doesn’t work for your LinkedIn audience. Test, analyze, and optimize.
Marketing attribution tools: How to choose the right one for your business
Google Analytics is easily the most widely-used tool for marketing attribution, but it’s not the only one.
Ruler Analytics is a powerful tool for connecting revenue to attribution so you can measure the marketing touchpoints at a dollar level. Oktopost provides robust analytics on B2B social media usage and social touchpoints contributing to conversion. AppsFlyer looks at marketing attribution within the context of mobile app growth.
Depending on your industry, growth stage, and business goals, you may choose to use one or a combination of these platforms.
Google Analytics
One of Google Analytics’ biggest draws is that despite being a robust product, it’s free.
This makes it easy for beginners to dip their toes into the world of marketing attribution, and start out with some of the more basic models like first or last click.
Google Analytics is suitable for monitoring baseline attribution across these channels:
- Paid and organic search (on all search engines, not just Google)
- Referral and affiliate websites
- Social media networks
- Custom campaigns, if you’ve set them up in Google Analytics (such as offline campaigns that direct traffic to vanity URLs)
If you’re converting more than 600 customers each 30-day period, you’ll also be able to take advantage of Google Analytics’ data-driven attribution model (currently in Beta). This model uses machine learning to understand which touchpoints are most likely to drive conversion, and assigns attribution credit accordingly.
Ruler Analytics
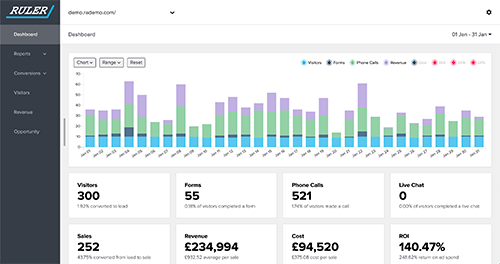
Ruler Analytics offers a number of helpful features beyond marketing attribution, like marketing mix modeling and predictive analytics.
However, its key benefit is the ability to connect the platform with your CRM and pull revenue data into your attribution model.
Attribution using standard models tells you which touchpoints and channels drive conversion. With Ruler Analytics, you get to understand how these touchpoints influence revenue.
Let’s say you’re able to determine that you have two main conversion pathways.
- Pathway one: 70% of your customers take it and it drives an annual customer value of $4,500.
- Pathway two: 30% of your customers take it (including every enterprise client) and the annual customer value is $560,000.
Without having closed the revenue loop, you likely would have invested more in the first pathway, which actually converts lower-value customers.
Use Ruler Analytics to gain a better understanding of how touchpoints in your marketing campaigns influence revenue, not just conversions.
Oktopost
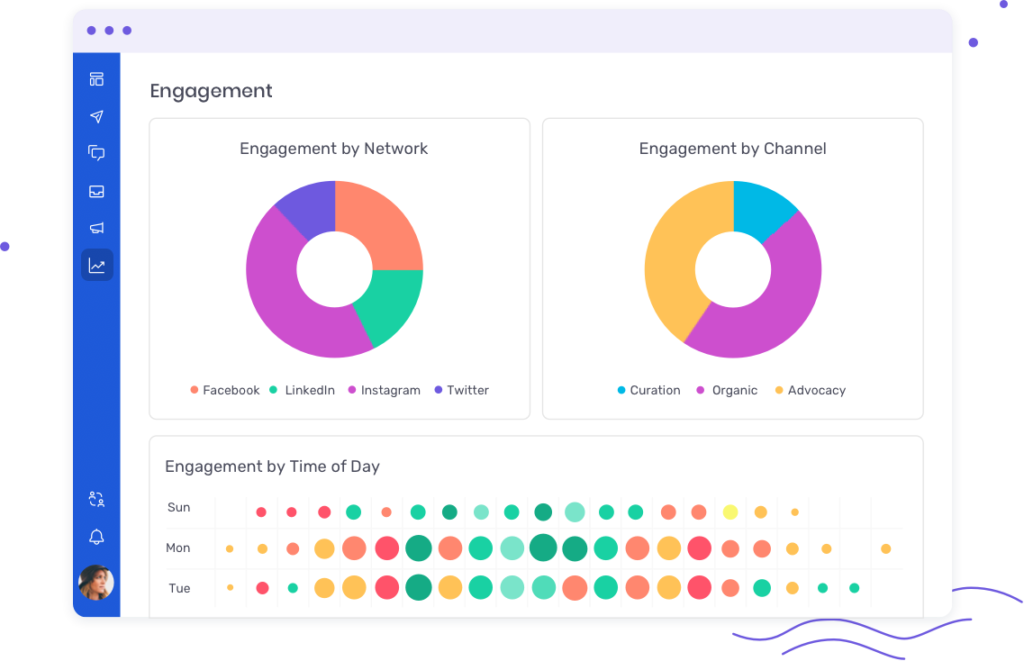
Oktopost is not precisely a marketing attribution tool; it’s a social media engagement management platform for B2B marketing teams.
B2B marketers are increasingly realizing the value of social, whether that be running ads on LinkedIn or having sales reps build personal brands on Twitter.
Oktopost helps marketers accurately measure and attribute the value of these activities.
You’ll be able to measure engagement by channel, content type, and region. You can even dig down to the post level to analyze how messaging, keywords, hashtags, and media types relate to engagement.
If you’re in B2B, use Oktopost to dig deeper into how social media impacts conversion beyond knowing that LinkedIn works for growing awareness.
AppsFlyer
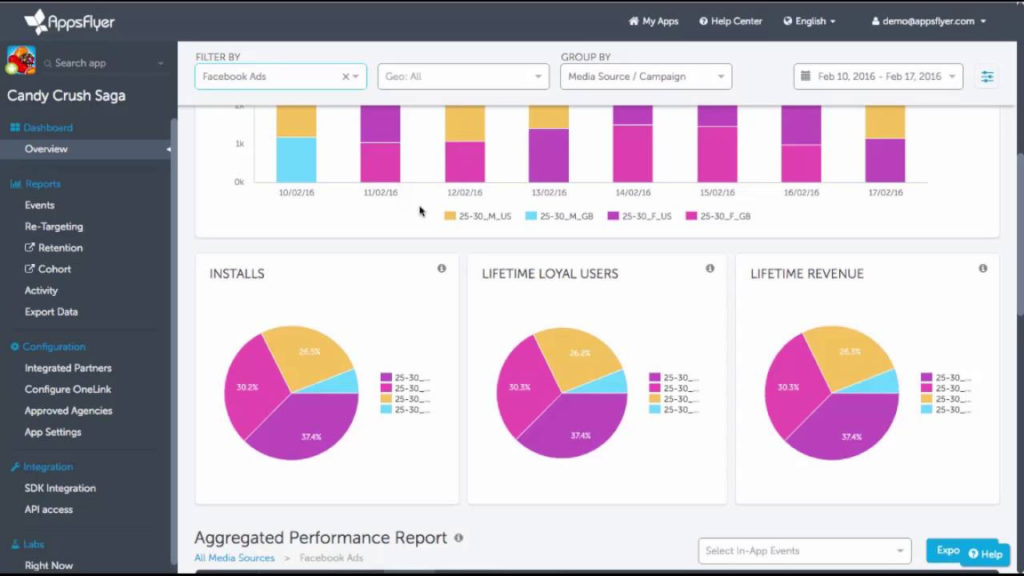
AppsFlyer is a marketing analytics platform specifically for measuring app growth.
Where other attribution tools tend to focus on conversions within a website context, AppsFlyer looks at attribution modeling within the mobile ecosystem.
With AppsFlyer, you can attribute credit to the touchpoints which lead to an app install. For instance, you can look at engagement with ads in other applications, and how they contributed to a new customer downloading your own.
Their attribution modeling extends to measure events within the app as well, so you can separately attribute app installs and conversions to paid plans.
Use AppsFlyer to understand how your ad network influences app downloads and improve the effectiveness of your ad spend allocation.
Conclusion
To gain a baseline understanding of how customers interact with various marketing touchpoints, the standard attribution models available in most analytics platforms will suffice.
For a more comprehensive look at which channels and tactics influence conversion, and to make data-driven decisions on marketing spend allocation, look to AI-driven algorithmic models.
Level up your attribution skills with our online course, packed with expert insights: Become great at Attribution.
Related Posts
-

You’ve worked all quarter on a new content marketing series and conversions are ticking upwards.…
-

Thinking about emailing influencers to ask them for backlinks or tweets? Most people are terrible…
-
One of the hardest things for any internet marketer is to figure out what to…
-
Product marketing is today’s most critical marketing function. And yet, it’s unfamiliar and confusing to…