
Here’s an uncomfortable truth about conversion rate optimization: lots of people are running bad tests without even knowing it. They’re making decisions based on false positives, they’re acting on inconsistent data, they’re avoiding the issue of sample pollution – I could go on.
For example, at CTA Conference in Vancouver, Bart Schutz of Online Dialogue took the stage and asked 400+ marketers to raise their hands if they know what sample pollution is. Less than 20 people raised their hands. In Bart’s words, “If you don’t know about sample pollution, stop testing.”
The first step to running better tests is to really understand a/b testing best practices and sampling. Is your a/b test sample large enough? Is it representative? Is it bias? If you don’t know how to sample correctly and preserve the quality / validity of your data, you’re wasting your time.
Table of contents
Sampling 101
What Is Sample Size?
Well, it’s exactly what it sounds like. It’s how many visitors or conversions you need in your test. It is incredibly important to calculate your sample size upfront. You don’t stop when you have 95% confidence, you stop when you have enough traffic / conversions for valid results.
If you don’t calculate your sample size before you run your test, you’ll run into bad data, likely without even realizing it.
So, how do you calculate your needed sample size? Just use CXL’ sample size calculator or other similar ones.
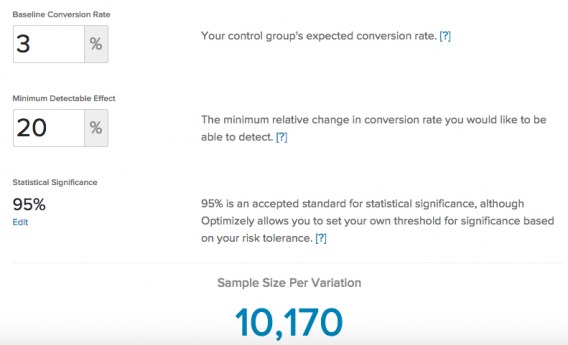
All you have to do is plug in: the current conversion rate of the page you want to run the test on, the minimum detectable effect (how big of an uplift you want to be able to detect), and the significance and power levels (usually defaulted to 95% and 80%, respectively).
Who Should Be In Your Sample?
Calculators can do the math and tell you how many people to sample, but they can’t tell you who to sample. Take a second to think about the different types of traffic that flow into your site every week and how their unique traits will impact your test results.
1. Weekday vs. Weekend Traffic
Does your Wednesday traffic behave the same way your Saturday traffic does? Chances are, the day of the week and time of day have an impact on the type of people visiting your site. The mindset people have on a Friday night is going to be different than a Monday morning. You want your test to include all of those people.

Angie Schottmuller, Growth Marketing Expert:
“Tests run best in full-week increments since day-of-week and day-of-month present seasonality factors. I perform discovery to better understand the buying cycle duration and target audience daily context (e.g. work schedules, school activities, child/adult bedtimes, biweekly/bimonthly paychecks, etc.) before setting test dates and times.”
2. Source of Traffic
Different traffic sources engage with your site in different ways. Open Google Analytics, select “Acquisition” and then “Overview”. Note how traffic from the sources behave and convert in different ways.
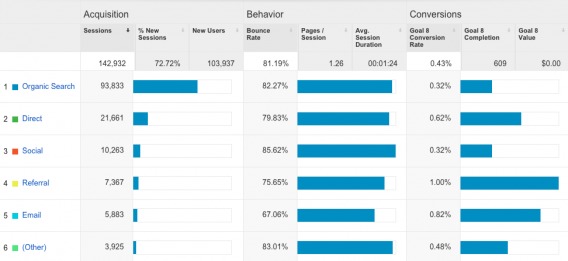
Will a visitor from Google search behave the same way a visitor from a Twitter ad will? Traffic sources are not created equal, so ensure that your sample includes traffic from all of the sources or ensure your test results from a single source are not applied to all sources.
3. Returning vs. New Traffic
Will a first time visitor behave the same way a third time visitor will behave? What about a 22nd time visitor? 100th time?
Returning visitors to an e-commerce site stay for an average of 3 minutes longer than new visitors. New visitors only view an average of 3.88 pages per visit while returning visitors view an average of 5.55 pages per visit.
Representative Samples
The key here is to have a representative sample. If you don’t account for the different types of traffic that will find their way into your sample, you’ll notice regression to the mean.
For example, let’s say you run a simple A/B test from Tuesday to Thursday. On Wednesday, your Director of Marketing switched on a Facebook ad campaign. According to your Director of Analytics, you see 2x more traffic on Saturdays. In the end, you see a lift in B, so you push that variant live.
By the following Tuesday, you’re no longer seeing that lift… it’s regressed back to the mean because the Tuesday to Thursday sample wasn’t representative.
Even weeks might be different.
Takeaway: To ensure you have a representative sample, run your test for at least 2 business cycles. That will be 2-4 weeks for most businesses.
What Is Sample Bias?
Sample bias is alive and well. Marketers can and do get attached to their hypotheses. Time and effort go into collecting data, analyzing it and coming up with a hypothesis. It’s easy to become emotionally invested in the outcome. You want your hypothesis to be correct.
In some cases, marketers will stop tests early or incorrectly analyze results to achieve their desired outcome. Often, they are not consciously aware that they are tampering with the results. That’s why experts like Kyle Rush, Director of Frontend Engineering and Optimization at Hillary for America, practice double blind experiments.
After designing the test, Kyle asks someone else on the team to change the variant names and numbers so that he too is blind to the results. He can’t favor his hypothesis because he no longer knows which is the control.
After the data comes in and has been analyzed, he can declare a winner. Only then does he find out if his hypothesis was correct, thus eliminating his natural bias.
What’s Sample Pollution?
Sample pollution is any uncontrolled external factor that influences your tests and results in invalid data. That’s a pretty broad definition, primarily because there are many different types of pollution. Unfortunately, many marketers aren’t even aware pollution exists, which means they’re unknowingly making business decisions based on invalid test results.
To identify whether or not your tests are polluted, run through the four most common types of sample pollution.
1. Length Pollution
As you know, time is a major factor when it comes to testing. “How long should I let my test run?” is one of the most common A/B testing questions I receive.
The truth is that there is no universal test length. Take Andrew Anderson, Optimization and Analytics Manager at Malwarebytes, for example. When asked how long he runs his tests for, he responded:
Andrew Anderson, Malwarebytes:
“I run it for at least 1 week of consistent data. By paying attention to the graph and looking for major relative inflection points you will get a much better read on normalization, population bias, as well as representative data sampling.”
For Andrew, who is working with a high traffic website, one week of consistent data is a representative sample. For most people, one week of data would be a convenient sample, not a representative sample. In other words, most people will need to run their tests for much longer than a week.
So while there are no absolutes, two full business cycles is standard. Therefore, most people shouldn’t be testing for less than two weeks. Four weeks is even better for the sake of validity, especially for more complicated and expensive products.
Length pollution comes into play when you stop a test too early or let a test run too long. So, if you stop a test when you reach significance instead of when you’ve reached the full sample (e.g. 400,000 visitors), you have length pollution.
On the other hand, the longer a test runs, the more likely it is that external factors (e.g. holidays, technical issues, campaign changes, etc.) will impact your test, producing invalid results.
How to Limit It:
- Consistent data is extremely important. If your sample includes anomalies (e.g. holidays, seasonal exceptions, etc.), you are acting on inconsistent behavior. Your winning variant likely won’t produce the same results next month. Look for spikes and pitfalls in your data to ensure a representative data sample.
- Only run tests for as long as you need to. Once you have collected data from a mathematically significant sample size, call it. The longer your test runs beyond that, the higher the risk of pollution (i.e. changes in context).
- Avoid running A/B tests during major holidays (e.g. Christmas) that might skew the results. It’s better to run holiday-specific test campaigns during those times (and most likely bandit tests).
2. Device Pollution
80% of Internet users own a smartphone, but that shouldn’t be news to you. This might be: 91% of people use their desktop / laptop to browse the Internet, 80% use their smartphone, 47% use their tablet, 37% use their gaming console, and 34% use their smart TV. Smartwatches and wristbands are following closely behind.
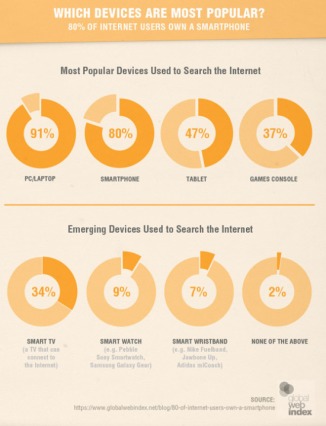
The point is that we all own and use multiple devices to browse the Internet, which means some of your visitors are being included 2-3 times because they’ve switched devices.
For example, if Visitor A lands on your site via her iPhone 5S and then two days later lands on your site via her laptop, there’s a 50% chance she’s seeing a different variant than she did originally.
Also consider that many devices have multiple users. Home computers, shared iPads, shared gaming consoles – not all devices are 100% personal.
For example, let’s say Brian visits your site from his family’s home computer on Monday and doesn’t convert. On Wednesday, Brad, Brian’s younger brother, visits your site from the same home computer and does convert. Your testing platform has considered both of those people to be the same person.
How to Limit It:
- Run tests separately for each type of device. Combining all of the traffic and testing it all at once might seem like a timesaver, but you run the risk of polluting your sample. As soon as you separate the devices, you limit the risk of pollution.
- Using Google Analytics Universal, you can track the same person from device to device. Unfortunately, this can be done only when you deal with user IDs. For example, if you have a user login system.
- Depending on the nature of your site, you can use known IDs from Twitter and Facebook to track visitors across multiple devices with a high degree of accuracy. Thus, the rise of the social login.
3. Browser Pollution
Browser pollution is very similar to device pollution. While most of us have a preferred browser, we end up using others out of necessity. Chrome has the plugin you need to watch American Netflix, but Safari has iCloud integration. Again, we run into the issue of including visitors 2-3 times, simply because they’ve switched browsers.
While there is no credible data on how often people switch between browsers on any given day, it is often enough that apps have been developed to make it easier. Objektiv allows developers and anyone who uses multiple browsers in their daily workflow to easily switch between default browsers.
Finally, if you use Google Chrome (and over 60% of the population does), you know about incognito mode browsing (others browsers have a similar mode, but call it something else). If someone opens a tab in incognito mode and visits your site, existing cookies will not be used and new cookies will not be saved after the tab is closed.
So, if the visitor returns to your site at a later time, she is appearing as a new visitor and, again, has a 50% chance of seeing a different variant than she did originally.
How to Limit It:
- Just as you can run tests separately for each type of device, you can run tests separately for each browser as well – but that’s a game for high traffic websites. That said, due to the fact that there is limited information available, it’s likely that fewer people are switching between browsers regularly.
- Once again, you can consider Google Analytics Universal and known IDs.
4. Cookie Pollution
At the root of all of this pollution is cookies. If you’re not familiar with a web cookie, it’s a small piece of data sent from a website and stored in a visitor’s web browser. It allows marketers to more accurately track their sample behavior.

Michael Aagaard, Unbounce:
“Your cookies are basically always at risk of being deleted. You can’t control whether your users choose to delete their cookies or not. As far as cookie expiry goes, a tool like VWO has a standard cookie duration of 100 days. If you are running tests you can’t conclude within 100 days, you seriously need to go back to the drawing board and come up with some better hypotheses based on actual insight. ”
Unfortunately, the data surrounding the rates at which cookies are deleted are shaky at best. Most reports are outdated (circa 2005) and, ironically, non-representative of the entire Internet population.
Lifehacker conducted a simple poll asking readers how often they delete their browser history. Here are the results as of September 23rd, 2015:
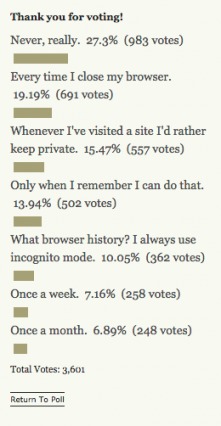
Of course, this is a relatively small sample of tech-savvy people. It’s highly unlikely that 20% of the entire Internet population deletes their history whenever they close their browser.
In 2012, Econsultancy released a report (based on 1,600 online respondents) that found that 73% of respondents regularly manage their cookie settings using their browser. When asked what they would say if a website asked for their permission to set cookies when they visit, only 23% responded yes (60% responded “maybe”).
40% of respondents think cookies are bad for the web.
Regardless of the exact numbers, the longer your test runs, the more likely it is that visitors will delete their cookies, polluting your sample. Just two weeks can make a difference, according to Ton Wesseling of Testing.Agency:

Ton Wesseling, Testing.Agency:
“I only say you need 1,000 conversions per month at least because if you have less, you have to test for 6-7 weeks just to get enough traffic. In that time, people delete cookies. So, you already have sample pollution. Within 2 weeks, you can get a 10% dropout of people deleting cookies and that can really affect your sample quality as well.”
How to Limit It:
- Don’t leave tests running for longer than necessary. The longer the test runs, the more opportunities there are for pollution. When you calculate your needed sample size ahead of time, make sure you can run the test in 4 weeks or less – or the pollution might start affecting the credibility of your results.
- There are ways to track visitors without the use of cookies. However, it is less mainstream and much more complicated – stuff like browser fingerprinting (declared illegal in the European Union).
- People are beginning to develop cookie alternatives, like Evercookie. Evercookie is extremely persistent, storing the data in more places and recreating the data after it has been deleted.
How to Avoid Sample Pollution
1. Ensure Consistency of Data
When A/B testing … Anomalies can sometimes get in the way. :) pic.twitter.com/s50WYliEsL
— Jakub Linowski (@jlinowski) June 30, 2015
Above, Andrew talked about consistent data, which means your data is unaffected by coincidental anomalies. Essentially, your data is behaving the way it normally does without the interference of unusual spikes or pitfalls.
Andrew Anderson, Malwarebytes:
“Look at the graph, look for consistency of data, and look for lack of inflection points (comparative analysis). Make sure you have at least 1 week of consistent data (that is not the same as just one week of data).
You cannot replace understanding patterns, looking at the data, and understanding its meaning. Nothing can replace the value of just eyeballing your data to make sure you are not getting spiked on a single day and that your data is consistent. This human level check gives you the context that helps correct against so many imperfections that just looking at the end numbers leaves you open for.”
In layman’s terms? Don’t run a test when your data is not behaving the way it normally does. Without consistency of data, your test results will not be applicable the majority of the time.
Many A/B testing platforms do not account for data consistency.
- Open up your testing platform of choice and dive into the data yourself.
- Look for spikes and other anomalies. Did you see an uncharacteristic surge in conversions on Tuesday?
- If so, run the test again.
2. Understand Variance
Variance and standard deviation go hand-in-hand with consistency. Essentially, they will tell you how far away from the average your numbers are. A low variance means your data is consistent with the average, which puts you at lower risk of pollution.
You can do the math manually yourself or just use a simple standard deviation calculator.
According to Andrew, variance is a major factor in eliminating sample pollution.
Andrew Anderson, Malwarebytes:
“Always account for variance and always pay attention to data patterns. You can be 99% confident at .5% lift, and I will tell you have nothing (neutral). You can have 3% lift and 80% confidence, if it is over a consistent week and your natural variance is below 3%, and I will tell you have a decent win.
In classic testing you want to preselect an audience size, but that ignores the realities of self selection bias as well as the thousands of small ways population sampling can get messy (let alone tracking is messy). By accounting for variance and by paying attention to the pattern of data, you can mitigate that risk (though never get rid of it).”
Accounting for variance and consistency, instead of just significance, will help prevent and reduce sample pollution.
Avoiding A/B Testing Risk
Sample pollution is simply unavoidable, no matter how long the test runs for. You can mitigate the risk, but never eliminate it. There is risk in every test you run, which means you have to be aware of the risk and analyze it before it begins.
The key is not to avoid the risk, but manage and balance it.
Conclusion
Running better tests starts with sample quality.
Is your sample large enough? Set your significance, power, and MDE and then check with a sample size calculator. Is it representative? Check your data personally for consistency and use a standard deviation calculator to account for variance. Is it bias? Consider running a double blind test so that favoritism doesn’t play a factor.
Before you run your next test, run through the following steps:
- Calculate your sample size using significance, power and MDE.
- Recognize the different types of traffic (e.g. weekday vs. weekday, source, new vs. returning) and their uniqueness.
- Eliminate your own personal bias as a tester.
- Run the test until you have reached your full sample, not until you have reached significance.
- Analyze your data personally to spot inconsistencies (and high variance) that might render the test invalid.
You’ll never fully eliminate sample pollution. Cookies will be deleted, multiple devices and browsers will be used, and environmental and technical factors will come into play. You can, however, minimize and isolate the pollution so that you’re acting on statistically significant (and relevant) data.
Related Posts
-

A/B testing is highly useful, no question here. But a lot of businesses should not be…
-
A/B testing is fun. With so many easy-to-use tools, anyone can—and should—do it. However, there's…
-
Sometimes A/B testing is made to seem like some magical tool that will fix all…
-
A/B testing splits traffic 50/50 between a control and a variation. A/B split testing is…


Good stuff.
One more source of pollution is, bots.
Has anyone experienced that? We’re beginning to see hints of weird inconsistent completion patterns which are (possibly) pointing at automated scripts trying to mix in with real people and screw with our tests/data.
We’re combating that right now on one test and hoping to release a write up in a future goodui.org/datastories issue. :)
Cheers,
J
Hey Jakub,
There’s a setting in your Google Analytics views that let you control for bot filtering — have you checked that box?
Talia Wolf writes about filtering bots from your conversion data here:
https://www.conversioner.com/blog/dont-let-your-google-analytics-data-get-polluted-3-things-to-watch
Thanks for reading, Jakub. (And for the Twitter art, hah.)
I agree with Momoko. Moz also published an article on preventing bots from distorting data earlier this year. It seems GA filters are a popular solution…
https://moz.com/blog/how-to-stop-spam-bots-from-ruining-your-analytics-referral-data
Also, here’s a list of spammy referrers from Perishable Press that might be helpful…
https://perishablepress.com/blacklist/ultimate-referrer-blacklist.txt
Yes, I’ve been seeing / hearing about a lot of malicious bot stuff – competitors killing competitors AB tests. Apparently not hard to do either.
Hey Shanelle,
Its really a good stuff you have shared here. I never really consider sampling as part of the process that will determine conversion rate optimization.
I guess I have been missing out a very crucial step for online success.
However, the ability to identify sample pollution will go a long way to help the marketer gain traction online!
I left this comment in kingged.com where this post was shared
Absolutely! Glad you liked the article. If you want to learn more on the subject, I suggest reading this post that Peep wrote:
https://cxl.com/stopping-ab-tests-how-many-conversions-do-i-need/
He goes into more detail re: sample size.
Hello Shanelle, I learned a lot from this post. By the way, would you mind answering a single question from me? Here it is, we turned our client’s website into a responsive design last month. After getting enough traffic (2,500 visitors), we’ve noticed that their conversion rate has dropped by half. Our problem now is, what report should we give to our client or what are we going to tell to our client knowing that the new mobile-friendly design didn’t show us any improvements after a month?
Most likely conversions tanked, happens all the time with redesign if no research is conducted. Read this https://cxl.com/website-redesign-higher-conversions-tread-lightly/
Thanks for reading, Andrew. Glad I could help!
Adobe Target has a sample size calculator, too:
http://adobe-target.com/testcalculator.html
Thanks Daniel. I actually haven’t used it before, so I’ll check it out.