Benchmark Your Ecommerce Website UX Against The Competition
Learn where you are falling behind and where you are winning.
Make better optimization and prioritization decisions.
Get quantitative data on how visitors perceive your site vs. your competitors.


Benchmark your site against 4 competitors of your choosing.
(Or against our pre-selected sample of 4-5 top sites in your ecommerce niche.)
Who Can Benefit From UX Benchmarking?
This service is for conversion-minded marketers who need to know the answers to these two questions:
- Is your website UX putting you behind your competition? If so, where?
- How and where should you prioritize your website testing roadmap?
Unique to ConversionXL, CUX Benchmarking is a rating scale used to measure multiple important dimensions of your website’s user experience.
With your CUX Benchmarking data in hand, you’ll have the power to:
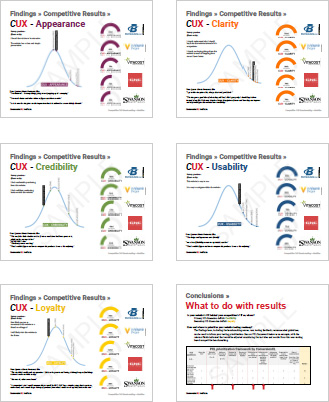
- Know exactly how your website compares to your competitors in these 5 crucial UX dimensions:
- Appearance
- Message Clarity
- Credibility & Trust
- Loyalty
- Usability
- Gain insight into your site’s UX strengths and weaknesses, improve your testing strategy, and prioritize the right tests

Here’s What Your Custom UX
Benchmarking Report Measures
Appearance – how does your site’s look and feel compare to your competitors?
Clarity – how do users perceive your value & benefits compared to your competitors?
Credibility – do users trust your site more or less than your competitors?
Loyalty – are users more likely to return to your site or to your competitors?
Usability – do users think your site is more or less usable?
Your CUX Benchmarking is based on quantitative data. We gather your users’ perceptions of your website using our proven questionnaire. Then, you use our findings to adjust and improve your testing strategy.
What Makes the CUX Benchmarking Approach Special?
Conversion Focused,
So You Can Apply the Results Practically:
We quantify user perceptions of your website’s value proposition, showing you exactly why users prefer your site (or your competition’s).
Quantitative,
So You Can Trust The Data to Speak For Your Users:
CUX questions are built to evaluate multiple factors that affect conversion. Our method measures 100+ user datapoints for each site, ensuring we don’t miss any significant trends or patterns.
Applicable to Any Industry:
Our approach can describe the quality of any website. It’s ideal for finding relative context to measure the effects of design changes, or comparing your site design to a competitor’s.
Comprehensive:
Includes 5 dimensions for measuring website user experience and the general quality of a website. You’ll receive actionable data to improve your site experience from the ground up.
Tried & Trusted Model:
The CUX model is based on extensive research on a massive user testing database.
CUX
How CUX Surpasses the Industry Standard (SUPR-Q)
We adapted our UX benchmarking survey, CUX, from the SUPR-Q: a comprehensive and proven measure of the quality of the website user experience.
Published in 2015 in the Journal of Usability Statistics, the SUPR-Q (pronounced “super Q”) presents a standardized survey metric that has proven to be a valid and reliable measure of UX.
The SUPR-Q metric correlates strongly with the System Usability Score (SUS) and Website Analysis and Measurement Inventory (WAMMI), both of which you might be familiar with if you’re a UX professional.
BUT the SUPR-Q fails in one key way.
It doesn’t provide insights into how a user perceives a site’s message (the value proposition), and how they decide to purchase from one site over another.
This “perception” dimension is similar to Loyalty, but more explicit in its assessment of your website’s message clarity.
The SUPR-Q measures user perception of a website in 4 ways:
- Usability
- Credibility
- Appearance
- Loyalty
To create CUX, we added the last crucial missing metric to the SUPR-Q: Message Clarity.
Is your message clear?
5 Dimensions of UX Give You Total Insight into What Your Users Are Thinking, Feeling, and Doing on Your Website

Here are the survey questions corresponding to each dimension of the CUX Benchmarking.
Questions are presented in a Likert scale format, allowing users to express a full range of agreement or disagreement with each statement.
Appearance
I found the website to be attractive.
The website has a clean and simple presentation.
Clarity
I clearly understand why I should buy from this website instead of it’s competitors.
I clearly see buying things from this website instead of shopping from stores I know better.
Credibility (Trust)
I feel comfortable purchasing from this website.
I feel confident conducting business with this website.
[non-ecommerce alternate] The information on the site is credible
[non-ecommerce alternate] The information on the site is trustworthy
Loyalty
How likely are you to recommend this website to a friend or colleague?
I will likely visit this website in the future.
Usability
This website is easy to use.
It is easy to navigate within the website.
Which Websites Will You Compare With My Website?
Depending on which CUX Benchmarking option you choose below, we’ll compare your website with a select sample of top ecommerce websites in your subvertical ($4000, or with 4 competitors of YOUR choice ($8000).
To start, your industry vertical is benchmarked against a select sample of 100+ ecommerce websites from Amazon’s Alexa’s Top 500 Sites on the Web, using 4-5 sites from each subvertical.
Your website and your competitors are ranked against this sample database of scored sites. You’ll see how you compare within your subvertical, as well as how your subvertical compares to the industry as a whole.
Clothing and Apparel
- Hatland
- Forever21
- Gap
- American Eagle
- J. Crew
- H&M
Nutrition
- Fitness First USA
- Swanson Vitamin
- GNC
- Vitacost
- Vitamin Shoppe
- Bodybuilding
Home Electronics
- Monoprice
- Sony
- Newegg
- Crutchfield
- TigerDirect
Sports
- Nike
- Dicks Sporting
- Goods
- Adidas
- Under Armour
- Sports Basement
Auto
- Autotrade
- Carmax
- Tirerack
- Carid
Pets
- Pequannock Feed
- Only Natural Pet
- Entirely Pets
- Petco
- Drs Foster & Smith
- Petsmart
Recreation
- Outdoor Action
- Cabela’s
- L.L. Bean
- Backcountry
- Bass Pro Shops
- REI
Home & Garden
- Pottery Barn
- Hayneedle
- West Elm
- Lowe’s
- Home Depot
Food
- Peet’s Coffee
- Dunkin Donuts
- Harry & David
- Nuts.com
- Netgrocer
Weddings
- Minted
- WeddingPaperDivas
- WeddingStar
- WeddingFavors
Visual Arts
- Redbubble
- FineArtAmerica
- Art.com
- Inprint
General Merchandise
- Amazon
- Walmart
- Ikea
- Best Buy
Toys & Games
- Toysrus
- Lego
- Hasbro Toy Shop
- Fat Brain Toys
Crafts
- Joann Fabrics
- Fabric.com
- Annie’s
- Love Knitting
Publication > Books
- Barns & Nobles
- Scholastic
- Abebooks
- Booksamillion
How to Use Your CUX Benchmarking Results
Every CUX Benchmarking Report includes specific expert recommendations for what you should do next, based on our CXL Prioritization Framework. This is what we use for all our in-house testing and optimization projects, so we know it works.
Some best-practice uses include:
- Keep Track of Your Competitors. Our rating scale and reporting make it quick and easy to see how your website’s appearance, clarity, usability, loyalty, and credibility are perceived, relative to your competition.You’ll know at a glance what’s working and what’s not, allowing you to make informed, hypothesis-driven UX decisions.
- Track Your UX Performance Scores Over Time. CUX Benchmarking is ideal for establishing a baseline for your UX. Easily compare your current site design against the results of your later design changes.
- Complement Your Existing Qualitative User Testing Feedback. You probably already collect qualitative, open-ended user feedback, but maybe you’re never sure what to do with that data? Cross-referencing just 5-10 user feedback sessions addressing similar UX dimensions as those covered in the CUX metric will give you highly actionable direction for design improvements.
How The Process Works
What happens after the purchase?
- Within 24 hrs, we’ll get in touch to confirm tasks and the websites to be benchmarked.
- Once the user task is confirmed, survey will be launched.
- After the survey is completed by at minimum 100 people, we compare results against our database of scored sites and your choosen competitors (if applies).
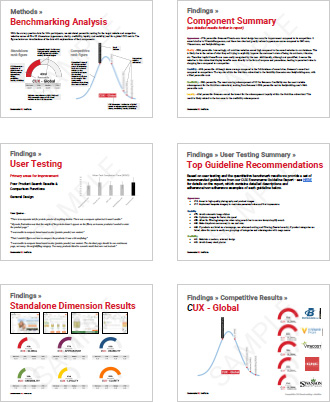
- Expect a final report similar to the below sample report within 3-4 working days.
Get an idea of what the final report looks like by getting this sample report: