
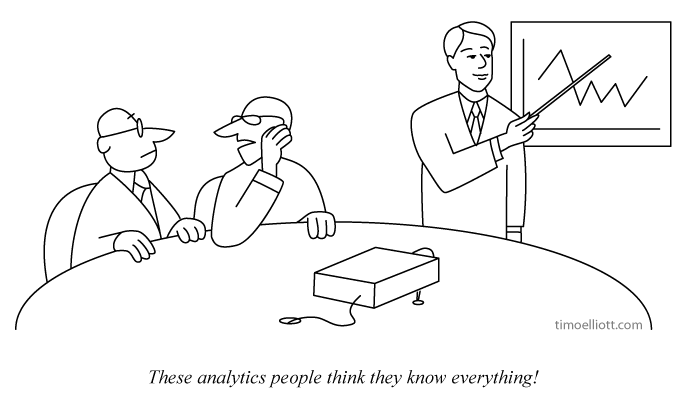
In digital analytics, it’s all about asking the right questions.
Sure, in the right context, you can probably get by doing what Avinash Kaushik refers to as “data puking,” but you won’t excel as an analyst or marketer.
In addition, you’ll consistently come up short on bringing true business value to your company.
In any field, it’s important to be critical. But in digital analytics, it’s crucial.
Table of contents
Be critical. Ask data analytics questions.
According to Tim Wilson from Analytics Demystified, “Most analyses don’t turn up wildly surprising and dramatic insights. When they do—or, when they appear to—my immediate reaction is one of deep suspicion.”
Similarly, Ronny Kohavi, VP and Technical Fellow at AirBnb, stresses following Twyman’s Law: “Any figure that looks interesting or different is usually wrong!”
Yet in the vast majority of digital analytics cases, we simply accept the numbers without questioning them.
The mark of a good analyst isn’t advanced knowledge of a tool’s interface, though that does help. And it’s not about running down a checklist to appease a manager, though processizing things can be valuable.
The best analysts can step back and think critically, ask important business questions, and answer them with a high-enough degree of precision to take action.
Why focus on business questions? Because the problems a business faces can be surprisingly unique, and trying to apply a formula or best practice tends to have the illusion of being insightful but, in reality, is just the easy way out.
Here’s how Avinash Kaushik put it:
If you are unique, why should you crack open a standard analytics tool with its standard reports and metrics and get going?
Or why simply respond to a “report request” and start data puking? The person at the other end is probably uninformed about Analytics and Segmentation and what is possible (even as they are supremely qualified to do their job in Marketing / Sales / HR).
You need business questions because:
1. Rather than being told what metrics or dimensions to deliver you want business context: What’s driving the request for that data? What is the answer the requestor looking for? Then you apply smarts because you have context.
2. Best practices are highly overrated. If this is your first day on the job, sure go ahead and puke out what “industry experts” recommend. But know that it won’t impress anyone because you don’t actually know what the business is doing / cares about / is prioritizing.
Top 5 questions to ask when analyzing data
With that in mind, there are a few questions that, in the hands of the right analyst, consistently bring value to an analytics practice.
They make you step back and reflect on how your organization is using data, and how you can improve on your data culture.
1. Is this data accurate? Can we trust it?
If no one trusts your data, it’s useless.
That’s why doing an analytics audit is so important: It forces you to question the integrity and quality of your data, and you’re forced into important conversations about what you’re collecting in the first place.
There are plenty of things at the account level in a given analytics system that should be subject to question.
For instance, is your Google Analytics data sampled?
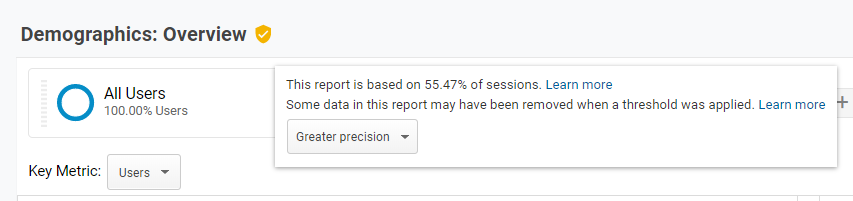
This is a simple question to answer, but the answer determines how you deal with your data. Maybe it doesn’t matter much to you, but maybe it does. Maybe your data is directionally important, and the precision isn’t as important. But you’d better ask the question.
For what it’s worth, there are many ways to get around the sampling issue in Google Analytics. But to begin thinking about solutions, you need to have the conversation first. (There are many other considerations with Google Analytics data integrity.)
At the highest level, you should go through your account report-by-report and question whether the data makes sense on an intuitive level.
Do you have a 100% bounce rate—or a 0% bounce rate? It’s very likely you have some issues with double pageview tracking or incorrect use of event tracking (e.g., you’re using interaction events when you shouldn’t be).
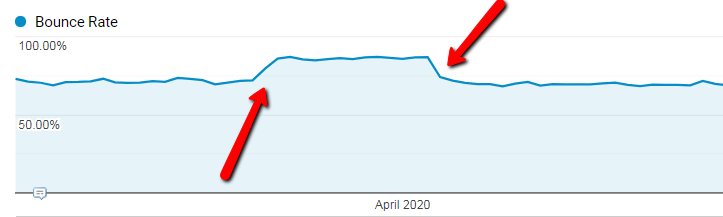
The solutions for these problems tend not to be difficult, yet finding the problems in the first place isn’t easy. Doing a full-sweep analytics health check isn’t common. Do this once and you’ll discover a ton.
More importantly, never stop questioning the integrity of your data.
Does my data line up with other systems?
Another important point to make here is that you can usually approach data from multiple angles. Doing so allows you to answer the sub-question, “Do my data sources line up?”
For instance, it’s not uncommon for your Google Analytics ecommerce data to be slightly different than that of your ecommerce software. This could be for a variety of reasons, but you want to make sure it’s within a reasonable degree of accuracy (i.e. >95% similar).
Tim Wilson calls this triangulation, and he emphasizes that you can do this for more than just ecommerce data:
Quite often, the initial triangulation will turn up wildly different results.
That will force you to stop and think about why, which, most of the time, will result in you realizing why that wasn’t the primary way you chose to access the data.
The more ass-backwards of a triangulation that you can come up with to get to a similar result, the more confidence you will have that your data is solid (and, when a business user decides to pull the data themselves to check your work and gets wildly different results, you may already be armed to explain exactly why…because that was your triangulation technique!).
This is the same reason we recommend to integrate your testing tool with your analytics data. That way, you can get another view of the numbers to check if things line up.
2. What’s missing? Do we have the full picture?
You may trust your data, but that doesn’t mean it includes the full picture.
This starts at the highest levels and goes all the way through your Google Analytics setup. For example, there are a variety of questions to explore within your property settings:
- Is the default URL correct?
- Are your referral exclusion settings correct (e.g., you use PayPal to process payments)?
- Is enhanced link attribution turned on?
- Have you enabled Demographics and Interest reports?
- Is Google Search Console linked properly?
- Google Ads integration
- Is it configured correctly?
- Is PPC data showing in Google Analytics?
- Are the resulting clicks and sessions recorded properly?
One of the most common problems in a digital analytics setup is the lack of correct cross-domain or subdomain tracking. This, of course, fundamentally fractures your view of the customer journey.
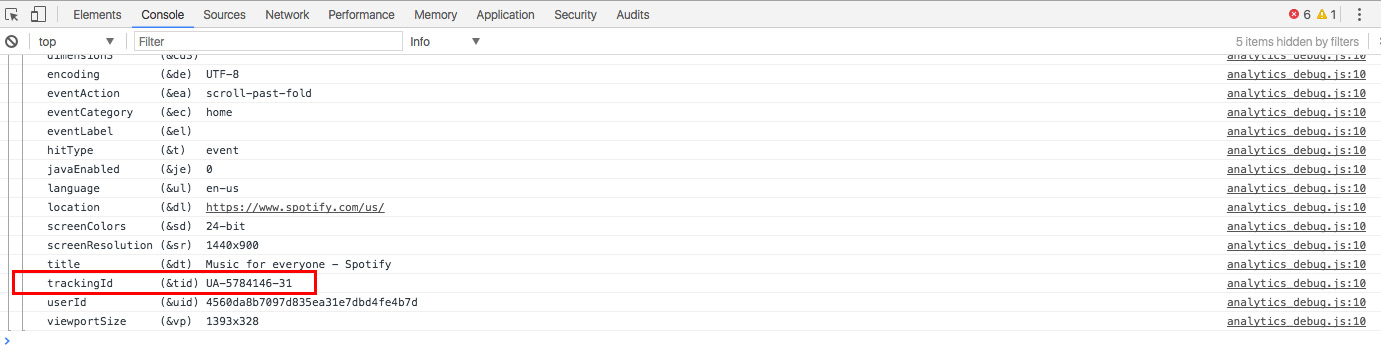
For example, I could listen to Spotify’s web app all day every day. I could be a power user, a paying customer, and yet, I still may want to wander over to their developer’s site every once in a while because I want to discover the most depressing Radiohead song using their API.
Sadly, Spotify sends this data to another Google Analytics property. This means that I’m a completely new user according to their developer’s site, and my user journey has become fractured (from their point of view). There’s no way, now, for them to track all of my behavior on their website.
You can tell this by using Google Analytics Debugger, a free Chrome extension that’s useful for doing analytics audits without even opening up the Google Analytics interface.
Here’s the homepage (spotify.com):
And the developer page: (developer.spotify.com):
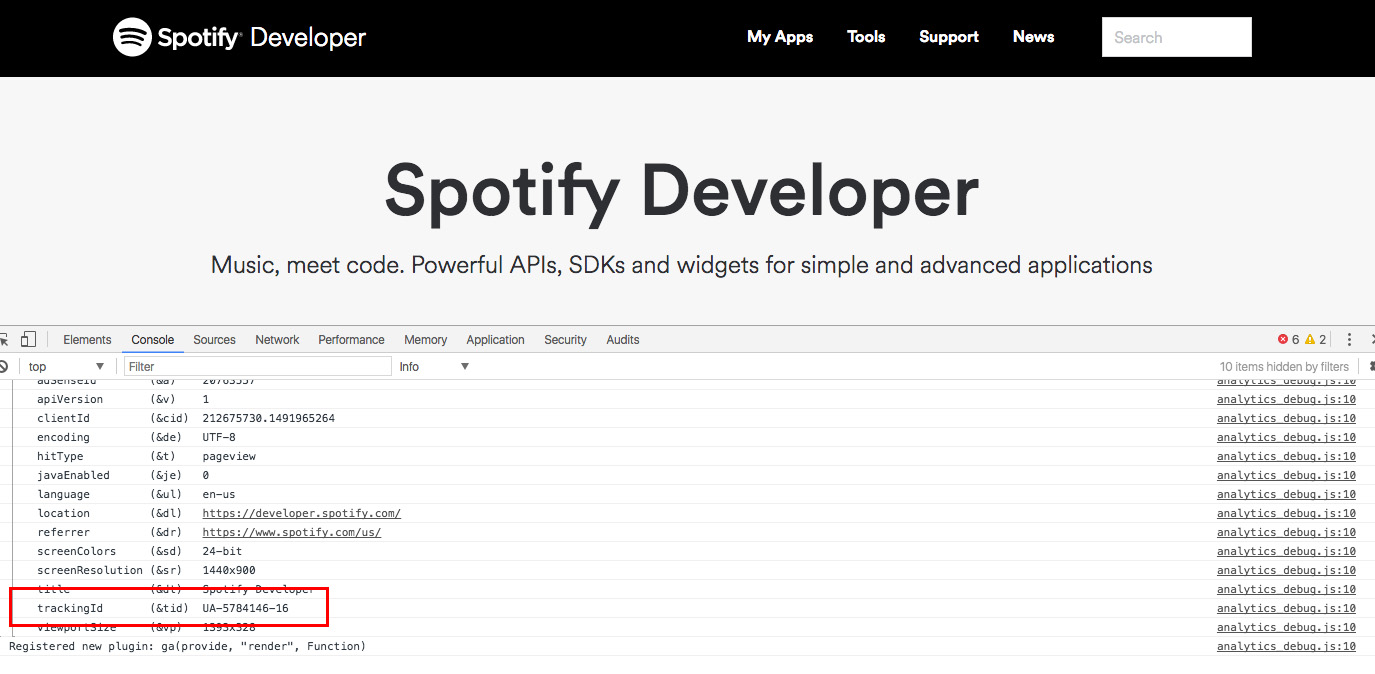
Different tracking IDs there.
Another area you might miss some granularity is with campaign tagging. Campaign tagging, at least in Google Analytics, is done with parameters in your URL. They usually look something like this:
http://www.example.com/?utm_source=adsite&utm_campaign=adcampaign&utm_term=adkeyword
There are five UTM tags used by Google Analytics:
- Medium;
- Source;
- Campaign;
- Content;
- Term.
The Medium and Source tags are required. It’s recommended you use a Campaign tag as well, so you can track individual marketing campaigns. Content differentiates versions in a campaign (if A/B testing messaging). Finally, the term “tag” identifies paid search terms that led to clicks.
While many platforms, including ad platforms like Google Ads or email services like Mailchimp, automatically append UTM tags to your URLs, some don’t. Without them, you may miss a huge part of your data that gets absorbed into Direct traffic or another channel.
Finally, the picture of your user can be fragmented because of many standard technical issues that, again, are relatively easy to fix but hard to spot. Here are a few we tend to look for when doing a health check:
- Missing tracking code on some pages, resulting in self-referrals or visits not recorded.
- Missing tracking code on 404 pages and server 500 pages.
- setDomainName missing on blog.mydomain.com, resulting in referring keyword lost and two visitor sessions.
- iFrame banner tracking resulting in double cookie.
- Missing ecommerce category.
- Site search using static URL or mod-rewritten URL, thus q=keyword not extractable.
- Quotation marks not escaped or ANSI characters not encoded in ecommerce category or item names.
- Missing manual tags in emails and newsletters & RSS, social, Google products, Google News.
- Violating Google’s terms of service by accidentally collecting personally identifiable information.
- URL fracturing in behavior reports.
That’s just a small part of what you should check for in your audit. For more information on Google Analytics audits, check out these articles:
- Google Analytics Audit Checklist: A DIY Health Check
- 20-Step Google Analytics Audit: The Key To Improving Performance At Every Level
3. Is this data meaningful?
If your organization wants you to build reports—without ever questioning what you’re actually trying to answer—well, I’m not sure I can help you. But if you have a bit of autonomy and a little curiosity, step back and ask, “What does this mean for the business?”
Often, you come to the sad conclusion that you can’t act upon the data you’re pulling anyway. This doesn’t negate the power of exploratory data analysis, but it questions the inherent value of certain metrics.
To use an extreme example, take how Buffer performed an “A/B test” on their tweets.
Version 1:
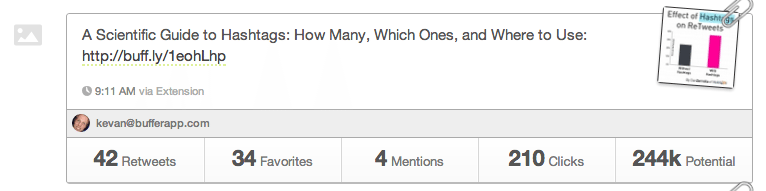
Version 2:

There’s a lot wrong with this, of course (e.g., different times of day, cherry picking data, etc.). But inherent in this is the question, “So what?” Are retweets your metric of choice? Why? Maybe they’re the most important leading indicator, and I’m out of line here, but it seems like grasping at straws.
Buffer isn’t a lone offender; we all do this. Without digging deeper, it’s easy to overestimate the importance of a given micro-conversion or micro-metric. That’s why it’s so important to question the importance of metrics, especially when everyone agrees on their importance.
When questioning the importance of metrics, the pendulum tends to swing. “Bounce rates are super important” leads to “bounce rates are useless.” The truth usually lies somewhere in between.
4. What can we measure and analyze to get more meaningful results?
How can we get more out of our data?
Asking these digital analytics questions slowly moves you up the digital analytics maturity curve:
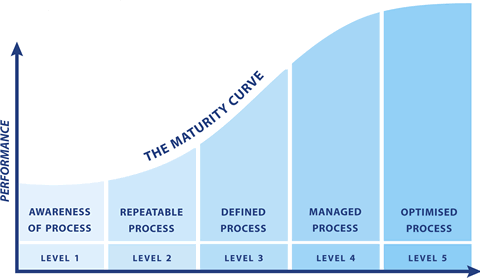
You move from foundational questions like, “Can I even trust these numbers?” and “Does this mean what I think it means?” to “What tracking should be in place for optimal insights and actionability?” and “Is this data usable and accessible by the teams that can act on it?”
Some questions you might ask at this level include:
- Have you mapped out meaningful events you’d like to track for a great view of customer behavior?
- Do you have defined outcomes/conversion points, KPIs, dashboards?
- Do you do segmentation, merchandising, and campaign optimization?
- Have you built data-driven or behavioral personas upon which you can take action (with targeting or otherwise)?
- Are your data sources merged in a way that you can view a larger part of the full customer journey?
- Are you using behavioral targeting?
- Are you using predictive analytics?
Of course, there’s a point of diminishing returns when you begin “tracking everything.” That’s not the answer to move up the maturity curve. Unless your organization is set up for it, you may introduce an element of unmanageable complexity to your data. Data is useful only if you can action on it.
Tracking every single thing can confuse a team that may have been better served by conservatively mapping out and focusing on a few key events. But, if you’re too conservative with your tracking, you may miss a larger picture of customer behavior. It’s a balancing act, not a copy/paste recipe.
5. Have I done proper QA?
QA is important for everything you do (not the least of which is A/B testing).
That means it’s important for analytics and reporting, too. Tim Wilson from Analytics Demystified puts it well:
Nine times out of 10, QA’ing my own analysis yields “nothing”—the data I pulled and the way I crunched it holds up to a second level of scrutiny. But, that’s a “nothing” in quotes because “9 times everything checked out” is the wrong perspective. That one time in ten when I catch something pays for itself and the other nine analyses many times over.
You see, there are two costs of pushing out the results of an analysis that have errors in them:
1. It can lead to a bad business decision. And, once an analysis is presented or delivered, it is almost impossible to truly “take it back.” Especially if that (flawed) analysis represents something wonderful and exciting, or if it makes a strong case for a particular viewpoint, it will not go away. It will sit in inboxes, on shared drives, and in printouts just waiting to be erroneously presented as a truth days and weeks after the error was discovered and the analysis was retracted.
2. It undermines the credibility of the analyst (or, even worse, the entire analytics team). It takes 20 pristine analyses* that hold up to rigorous scrutiny to recover the trust lost when a single erroneous analysis is delivered. This is fair! If the marketer makes a decision (or advocates for a decision) based on bad data from the analyst, they wind up taking bullets on your behalf.
Analysis QA is important!”
Every time you QA your reports, start with common sense: Do the numbers look weird? Remember, there’s usually something fishy about numbers that are too surprising or different. Never take them at face value; always question.
In addition, just as you should proofread blog posts, proofread reports. Wilson walks through his standard process for proofreading:
- Pull up each query and segment in the tool you created it in, then walk back through what’s included.
- Re-pull the data using those queries/segments and do a comparison with wherever you wound up putting the data to do the analysis.
- Proofread the analysis report—no need to have poor grammar, typos, or inadvertently backwards labeling.
Conclusion
Being good at analytics is about asking good questions. It’s not about “data puking,” or blindly reporting metrics without questioning their accuracy, integrity, importance, or actionability.
The moral of the story is that, with data, taking the extra minute to question things may bring nonlinear value to your program. More data isn’t always a good thing; if it’s poor-quality data, you may increase confidence about bad decisions.
Take the time to ask critical questions, and your program will improve with time, as will your clarity and business decisions.
Working on something related to this? Post a comment in the CXL community!
Related Posts
-

A/B testing tools like Optimizely or VWO make testing easy, and that's about it. They're…
-
After reading some subscriber feedback, we noticed that many CXL readers didn't have a solid…
-
This post is not a dry feature-by-feature comparison, nor does it include a winner-take-all verdict.…
-
Over the last years, Google Data Studio has evolved from an appealing but clunky application…


Very nice post.
Good one Alex :)
Thanks Diana!
Very helpful post Alex. Great insights you have here.
danke schön