Every digital marketing practitioner, whether in SEO, CRO, copywriting, content marketing, analytics, or UX, will inevitably have to explain bounce rate to concerned clients. Unlike other metrics on Google Analytics’ dashboard, bounce rate is relatively ambiguous and hard to grasp.
As explained in our bounce rate guide, a bounce occurs whenever a user enters your page and does not further interact with the elements on said page or any other pages on your site.
Bounces might be triggered by returning to the search results page, closing the browser, following an outbound link, or reading the entire page, but not triggering any events and leaving.
Next comes the inevitable follow-up question: “what is a good bounce rate?” This, unfortunately, isn’t nearly as simple to answer.
This article will explore the nuances of this tricky question by benchmarking what bounce rate averages look like by website type, industry, channel, and device. Then we’ll discuss how to set a baseline bounce rate. Lastly, we will discuss the implications of varying benchmarks on how you should interpret your website bounce rate.
Table of contents
Average Bounce Rate by Website Type
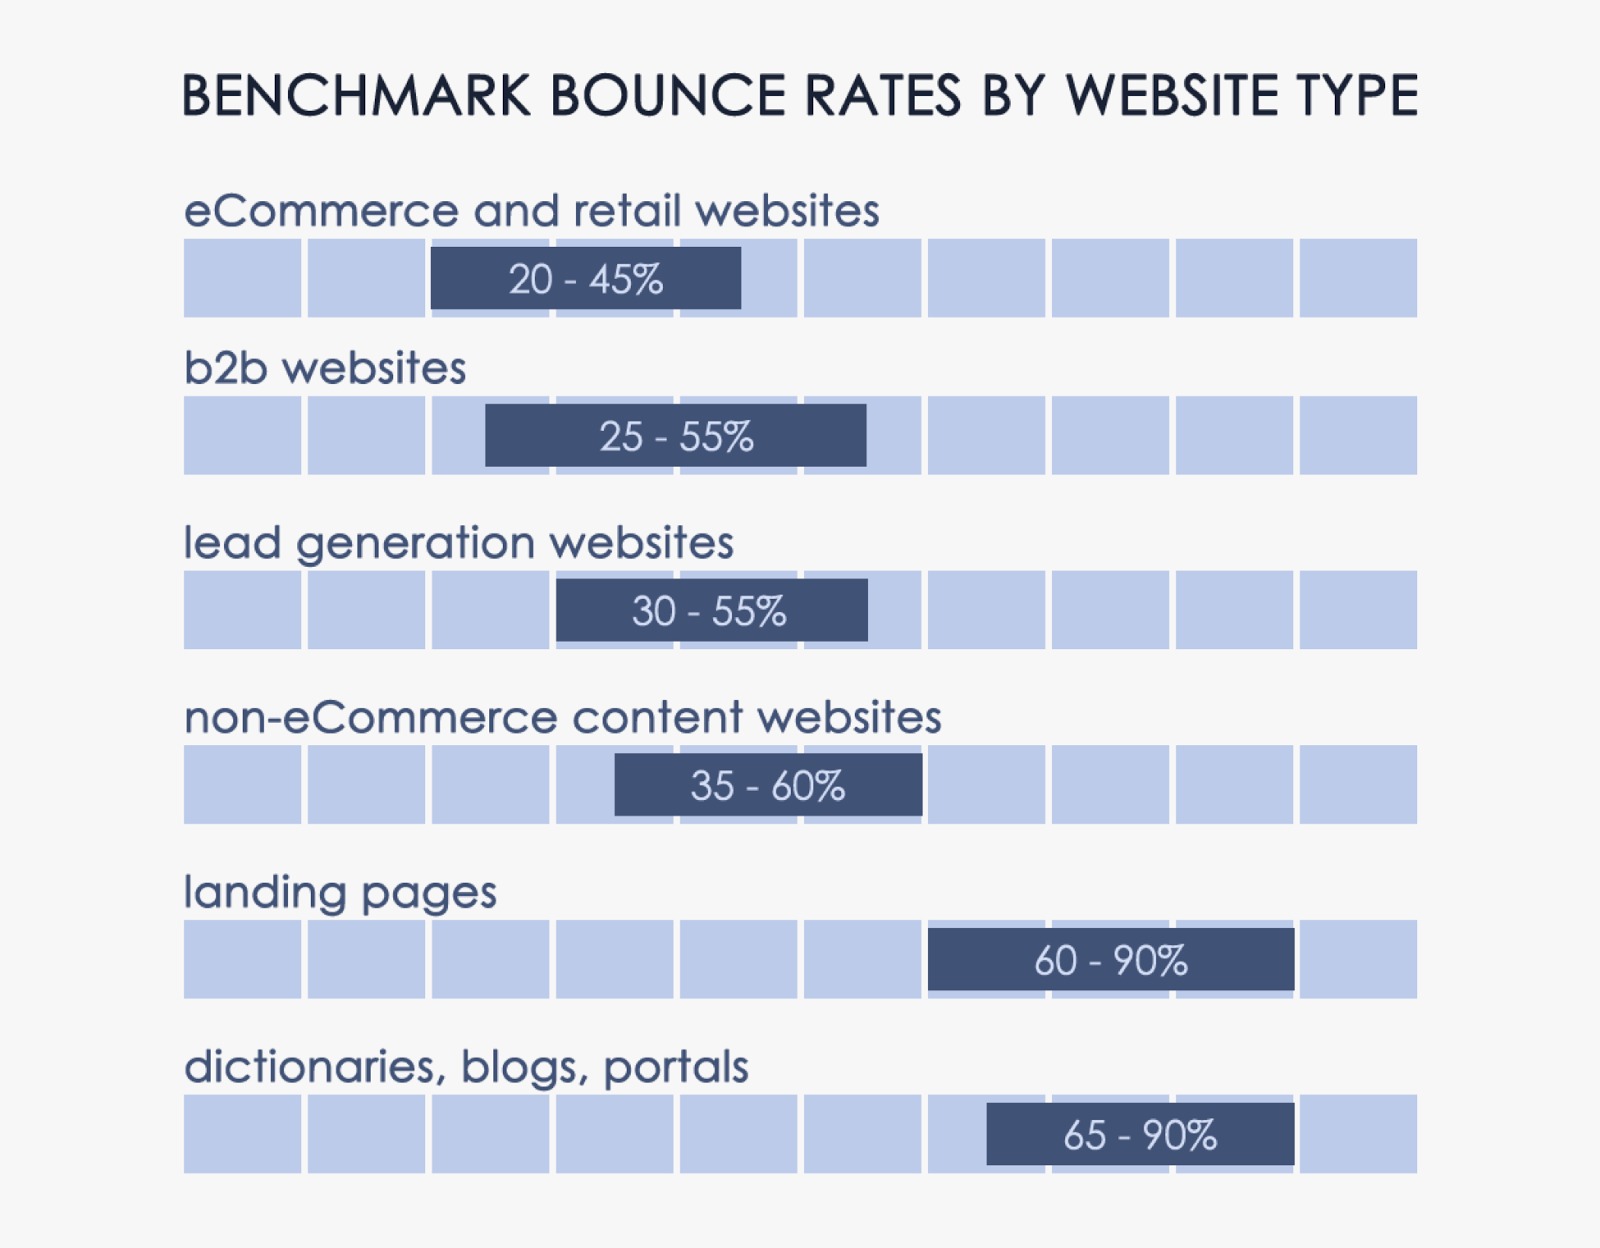
Our first reaction when posed with a high bounce rate is negative. We want to know why our users aren’t drawn in by our site content/design/UX/etc. Luckily, most of us can rest easy because bounce rate isn’t necessarily negative. Rather, your targeted and expected bounce rate should reflect the purpose of your webpage.
Let’s walk through two examples.
1. Blogs and Content-Oriented Pages
Blogs should expect relatively high bounce rates. A well written post will satisfy users with the content, causing them to leave after absorbing it. While some users will be engaged enough to comment, often, most are content being silent consumers of content. More importantly, since most users land on a blog article page through links on social media posts, they’re likely to return to the social media site after they have finished reading. This natural user behavior makes high bounce rates almost inevitable.
Therefore, even though some blogs and content-oriented sites do a fantastic job with internal linking and advertisements to direct users to other areas of the website, the average blog has a relatively high bounce rate.
2. Informational and Reference Pages
The contact information page is a classic example of a bounce-worthy page. Once users see the phone number/email/address they need, their next step is to contact you through whatever means provided. The result is their exit from the site and dialing your number, writing an email, or driving to your location – Google Analytics marks this as a bounce.
Other informational pages that follow the same pattern might be your eCommerce sale receipt and confirmation pages, customer support (FAQ) pages, and form submission pages.
Therefore, the first step to analyzing your own performance, is to see where you fall among your competitors. Don’t compare yourself to an eCommerce site if you’re a blogger – it’s like comparing apples to oranges. Instead, make use of the below infographic, which presents data from Customedialabs, to find the expected bounce rates for different website types.
Benchmark Average Bounce Rate by Industry
The purpose of a webpage is not the only thing affecting your probable bounce rate. To be accurate in our estimates, we must also account for the industry you operate in.
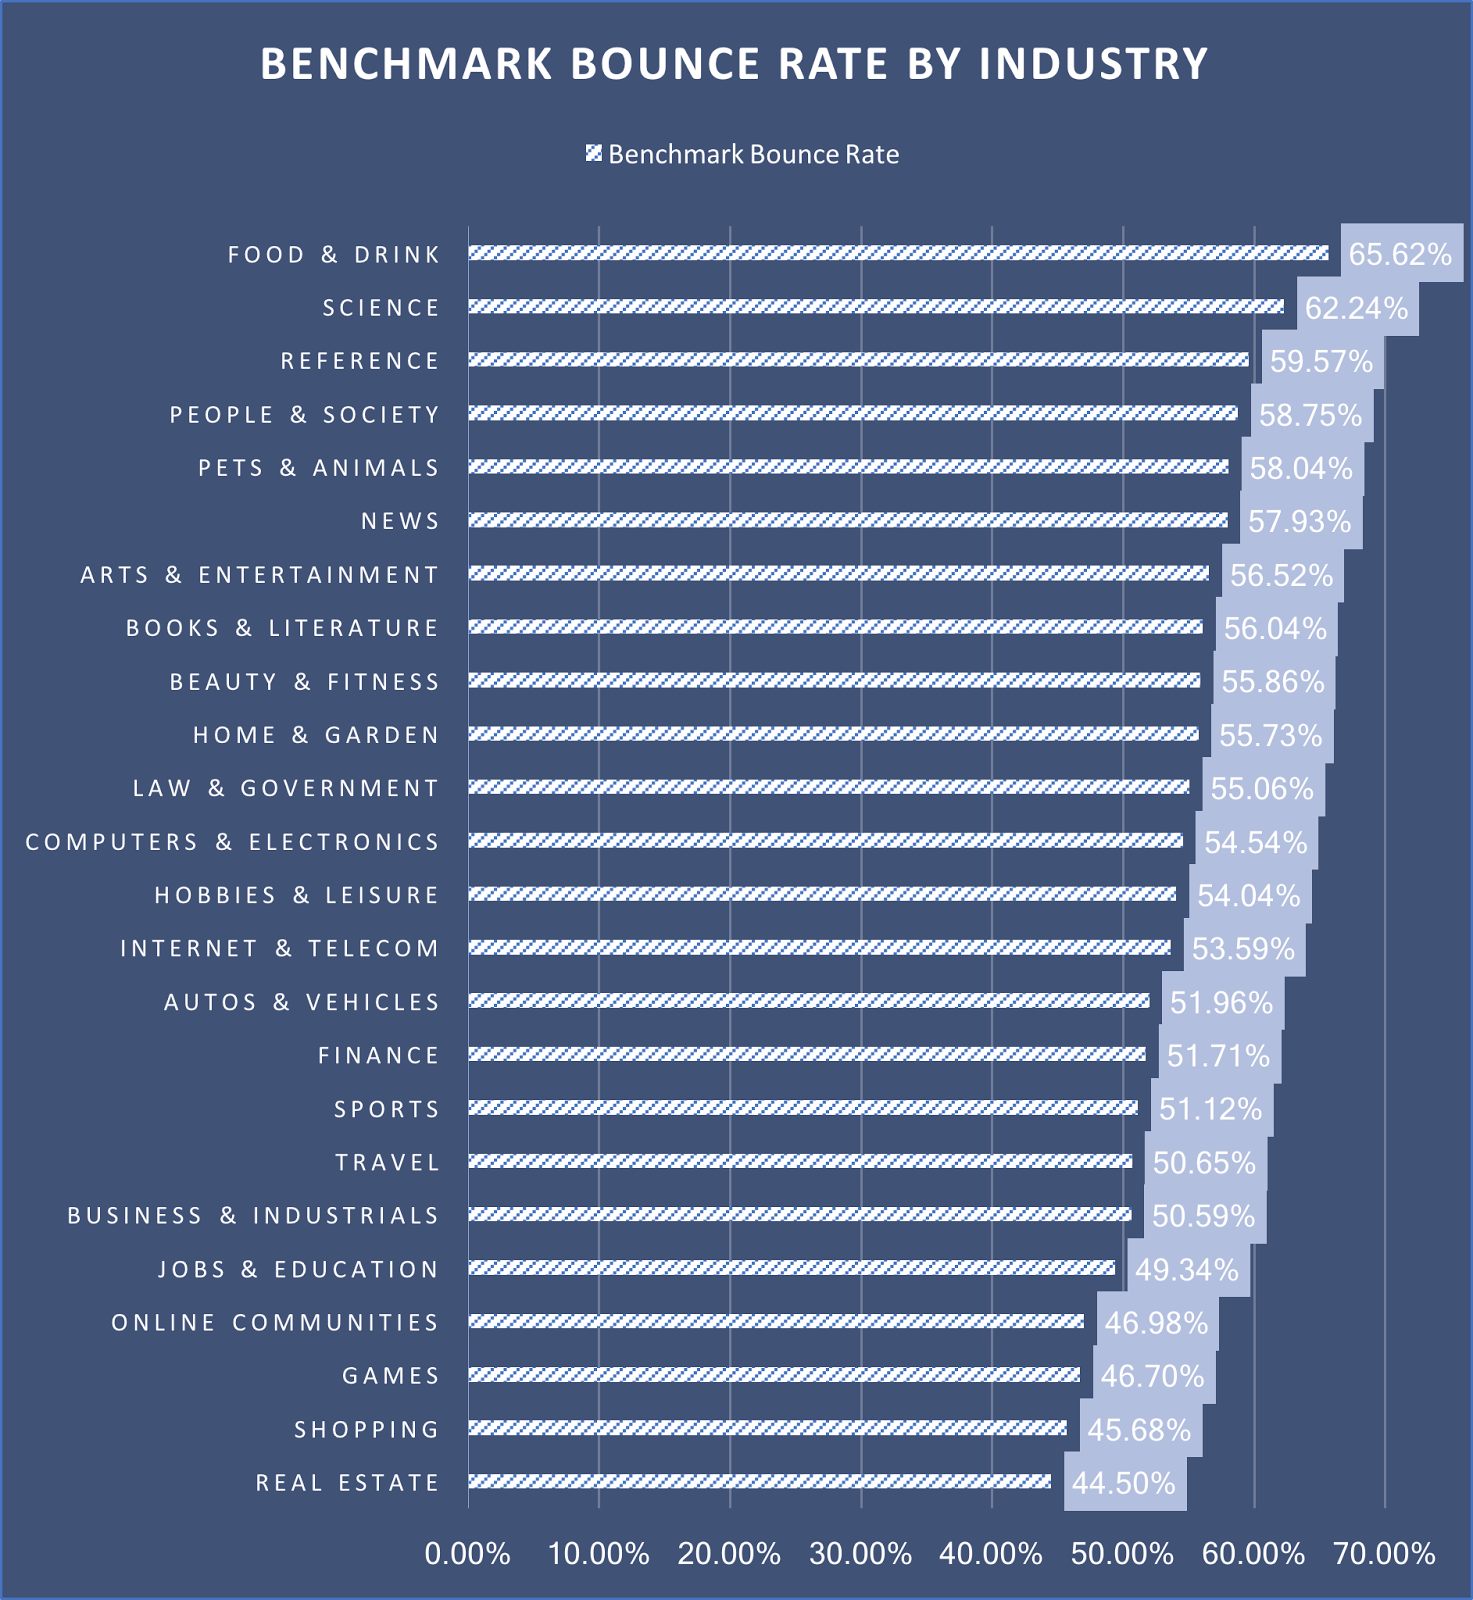
Here’s the same data formatted in a table. This is the average benchmark bounce rate by industry:
| Industry | Average Bounce Rate |
| Food & drink | 65.52% |
| Science | 62.24% |
| Reference | 59.57% |
| People & society | 58.75% |
| Pet & animals | 57.93% |
| News | 56.52% |
| Arts & entertainment | 56.04% |
| Books & literature | 55.86% |
| Beauty & fitness | 55.73% |
| Home & garden | 55.06% |
| Computers & electronics | 55.54% |
| Hobbies & leisure | 54.05% |
| Internet | 53.59% |
| Autos & Vehicles | 51.96% |
| Finance | 51.71% |
| Sports | 51.12% |
| Travel | 50.65% |
| Business & industrials | 50.59% |
| Jobs & education | 49.34% |
| Online communities | 46.98% |
| Games | 46.70% |
| Shopping | 45.68% |
| Real estate | 44.50% |
The difference in benchmark bounce rate between the food & drink industry and the real estate industry is more than 20%.
One explanation for this difference might be the structural differences between food & drink websites and real estate websites.
Whereas most restaurant websites are simple, offering concise information on location, hours, phone number, with most users bouncing after viewing the information, real estate websites consist of multiple pages featuring different properties, encouraging users to browse the site rather than exit.

While this article provided the benchmark bounce rates for general industries, you may find it useful to dwell a little deeper and look up the benchmarks for your specific industry. To do this, you’ll want to use the benchmarking feature on Google Analytics.
Google lets you view data for over 1,600 industry categories. You can also add controls for traffic level (5000-9999 sessions) and geographic location (United States – All Regions). Accessing this data is easy, just open the Benchmarking options found in the Reporting tab under Audience.
Average Bounce Rate by Channel
Sometimes knowing the overall industry average bounce rate isn’t enough. This is especially true if you want to analyze the return on investment (ROI) of advertising campaigns or understand the quality of your leads. Doing this requires considering bounce rates of channels.
In Google Analytics, channel describes the origin of traffic to your site. Google considers a few channels:
- Direct: visits where user navigated directly to URL of page
- Organic Search: visits from organic (unpaid) search results
- Paid Search: visits from PPC campaigns in search results
- Display: traffic from displayed advertising (e.g. banner ads)
- Referral: visits from users clicking on links from another site
- Social: visits from social networks (e.g. Facebook, Twitter)
- Email: visits from users clicking on links in emails
Knowing the differences in bounce rate between the various channels of your pages can help you pinpoint where to focus your improvement efforts. It can also help you avoid optimizing for site usability and content in an attempt to lower bounce rate when the real problem is the placement of your ad campaigns.
Consider a scenario where you have a fantastic site and are confused why your bounce rate is so high. Considering bounce rates by channel, you’ll realize it is because most of your traffic comes from display advertisements. A high bounce rate is therefore expected as a result since because are in general, more likely to bounce when they arrive at your page due to an ad than when they visit your website directly.
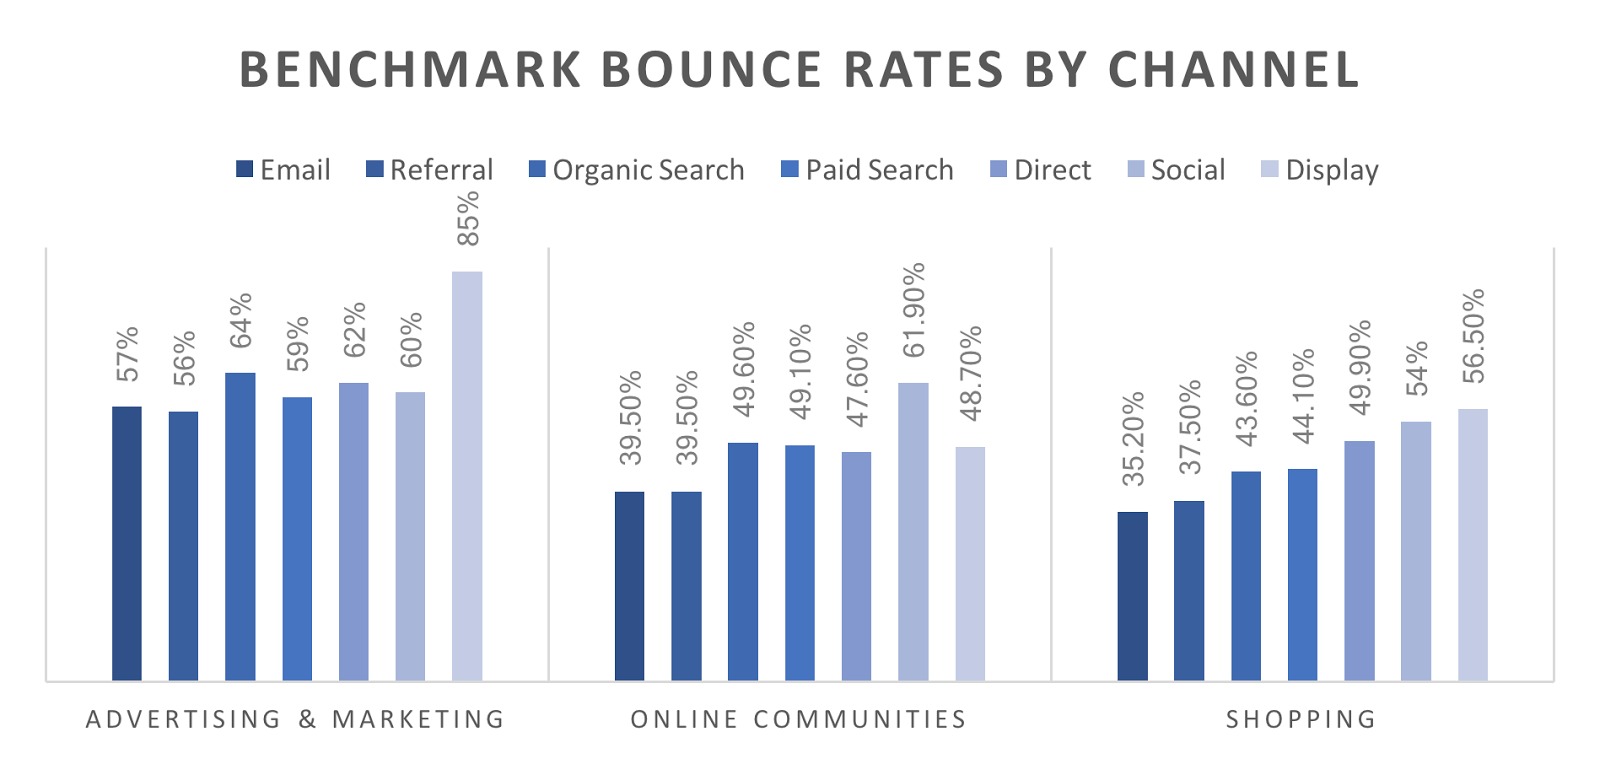
Looking at the average benchmark bounce rates by channel for the Advertising & Marketing, Online Communities, and Shopping industry categories, we can make a few observations.
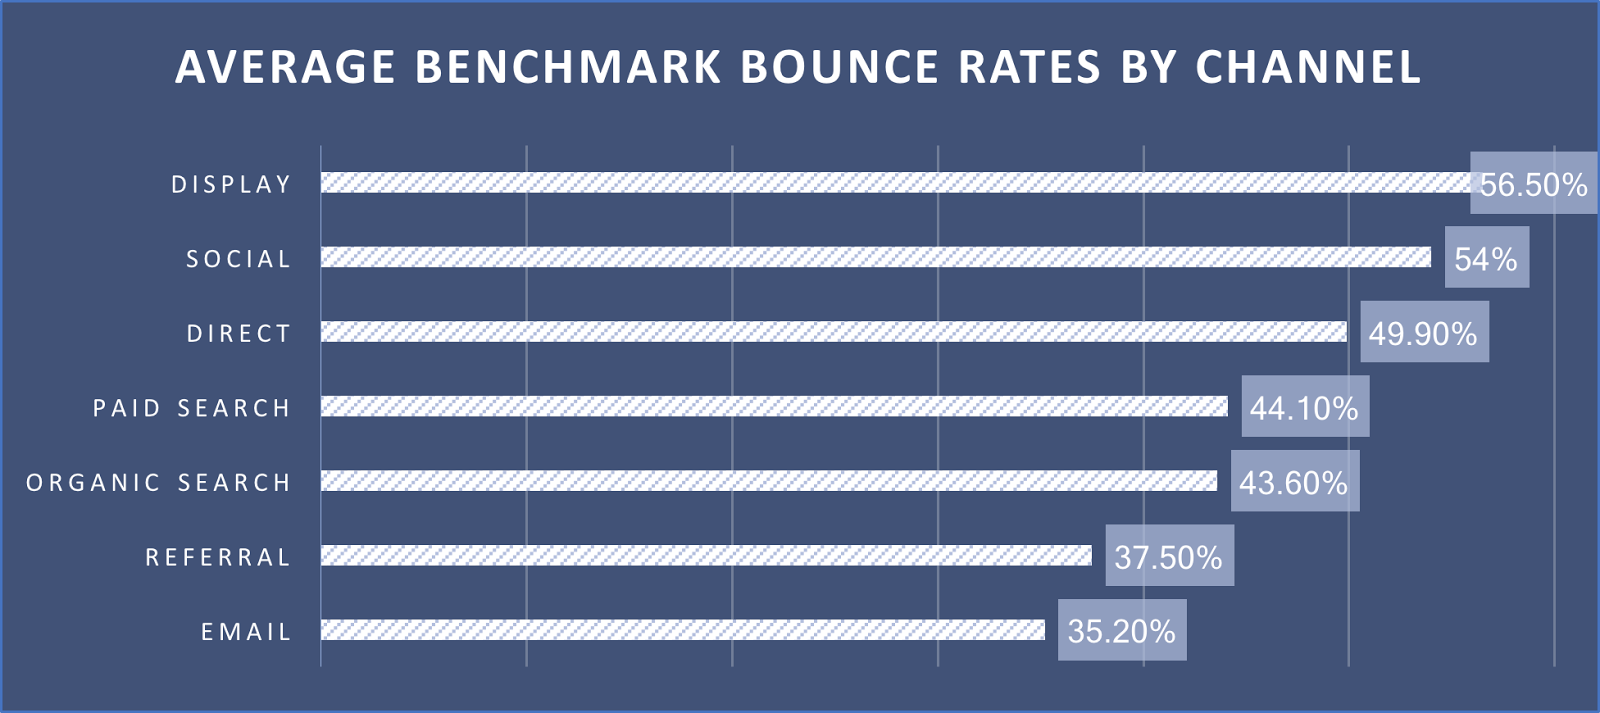
Here’s the same data formatted in a table, for average benchmark bounce rate by channel:
| Channel | Average Bounce Rate |
| Display | 56.50% |
| Social | 54% |
| Direct | 49.90% |
| Paid search | 44.10% |
| Organic search | 43.60% |
| Referral | 37.50% |
| 35.20% |
First, display has the highest bounce rate. A few reasons: banner ads and other third-party advertisements are viewed as “clutter” and intrusive over internal promotion, banner ads are the least trusted form of advertising, and the placement of your ads may introduce your page to a group of uninterested users.
Second, social has the second highest bounce rate at 54%. In fact, sometimes, social media bounce rate may be 2-3 times higher than your bounce rate from other channels. As mentioned earlier, social induces high bounce rates because people want to see your content and then return to their browsing.
Since most people access social media on their phone, this problem becomes even more apparent. Mobile phone users experience your page while still in the social media app of their choice and have only one end goal in mind: read content, return to main app page.
Therefore, their focus is only temporarily held by your page and they are less likely to click on other parts of your site. At the same time, most people are enticed by the very specific social share they saw and are not necessarily interested in what your site offers beyond that (more on the CRO implications of “going viral” via social here).
Third, referral and email have the lowest bounce rate.
The biggest reason for this is targeted audience that is already primed to be interested. More likely than not, if you have a backlink or a referral from another site, that site targets an audience that would be helped and interested in your content. As a result, they’re more likely to be engaged after arriving at your site.
Similarly, people who receive your email/newsletter/transactional emails likely opted-in to your promotions because they’re interested in what you offer and what to hear more about it.
Average Bounce Rate by Device
Lastly, we can take a look at benchmark bounce rates by device. We see the same pattern consistently across industries: mobile users bounce more than desktop users with tablet users falling somewhere in the middle. The reasons for these differences are intuitive, with mobile users more likely to change focal points and move between different apps than desktop users.

This can have serious implications for your webpage, especially if the majority of your traffic comes from mobile users. First, analyze whether the reason behind your high bounce rate is the result of unproportionate amounts of mobile users. Second, consider optimizing for mobile users or even creating separate mobile landing pages:
- 4 Things That Work For Mobile Landing Pages
- Making Mobile Convert: Common Mobile Store Mistakes
- Why Responsive Design Is Not Optimization
Setting a Baseline Bounce Rate
It is important to set your own baseline and work towards improving it rather than rely solely on meeting benchmarks.
The question, after all, is not “What is the average bounce rate?” but rather, “How does our bounce rate compare to similar webpages?” Even better, “how can I improve my current bounce rate?” (More on that question in another section of this guide).
Therefore, while the benchmarks and averages provided in this article are a good place to start and gain a broader overview of where your bounce rate should aim to be, setting your personal baseline requires a bit more effort on your part.
There is no “right” bounce rate; it’s all contextual.
Conclusion: Benchmarks and Segmentation
To wrap up this discussion, we must mention segmentation. Ultimately, everything in this article boils down to the concept of segmenting data. Bounce rate can be a deceiving KPI, appearing good or bad depending on how you evaluate and segment data.
Therefore, we will leave you with a simple scenario:
You operate a local business in Austin, Texas. Yet, most of your traffic comes from outside of the capital city due to you high ranking for many keyword phrases. Visitors see your location and leave, heading back to search results. As a result, your bounce rate is incredibly high.
What is really to blame in this scenario? And will improving site UX, like so many articles suggest, really fix the bounce rate? You tell us.
That’s why “average bounce rate” and “bounce rate benchmarks” can be misleading, and you need to analyze bounce rate in the context of your own business.
Read Next Lesson or Download guide as PDF
-
Bounce Rate in Google Analytics
Since Google Analytics is far and away the most popular web analytics tool, it pays to know exactly how bounce rate is calculated in Google Analytics. -
Bounce Rate Benchmarks: What’s a Good Bounce Rate, Anyway?
"What's a good bounce rate?"...common question, not a super clearcut answer. This piece will explore bounce rate benchmarks and give you a good baseline understanding of where you may stand. -
Email Bounce Rate: How to Manage Soft & Hard Email Bounces for Better Performance
While most people think of bounce rates in terms of website analytics, email bounce rates are a thing, too. -
The Top 4 Ways to Lower Bounce Rate
Now for the meat of the guide: how do we lower bounce rates? -
The SEO Impact of Bounce Rate (What You Need to Know)
Does bounce rate affect SEO? Some say yes, some say no, but this article spits the truth of the matter. -
Bounce Rate vs. Exit Rate: What’s the Difference?
Unfortunately, the two metrics are often misunderstood and used interchangeably, when it is their subtle differences that make them useful metrics. -
Conclusion
Summary and wrap up.