Since Google Analytics is far and away the most popular web analytics tool, it pays to know exactly how bounce rate is calculated in Google Analytics.
Table of contents
What is Bounce Rate in Google Analytics
Google Analytics measures bounce rate as the percentage of visitors who view a page in our website, then leave the website.
How Exactly is Bounce Rate in Google Analytics Calculated
The definition seems straightforward, but there’s a bit of ambiguity, mostly stemming from how GA themselves defined bounce rate. Here’s the definition directly from their support page: “A bounce is a single-page session on your site.”
The page also notes that bounce rate in Google Analytics is “single-page sessions divided by all sessions, or the percentage of all sessions on your site in which users viewed only a single page and triggered only a single request to the Analytics server.”
This, however, is confusing to most people who are new to Google Analytics and how they calculate metrics. The rest of the paragraph on that page clears things up a little bit:
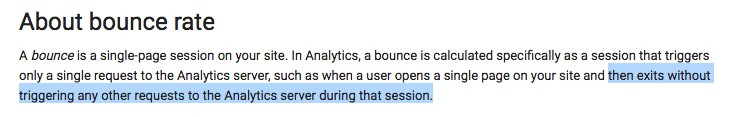
“Without triggering any other requests to the Analytics server during that session,” is what matters. Because, depending on how you have events set up in Google Analytics, someone could actually come to only one page and exit, and not be counted as a bounce.
Why Your Bounce Rate in Google Analytics May Be Inaccurate
Let’s say someone arrives on a sales page. It contains multimedia, copy, and multiple sections with the ability to navigate to each section on the page. Something like this:

Now, when I land on this page, Google Analytics records a “Page View” by default. But if we’re just using GA out of the box, then I could interact on this single page in many ways, and if I don’t click to a new page, I could be counted as a bounce.

So even though I interacted with the page in many meaningful ways – I used navigation to reach a specific section, I played a promotional video, and I started a chat on Intercom – an out of the box Google Analytics set up may register this as a bounce.
But is this really a bounce? I don’t think it should be. Especially because that Intercom chat could have turned into an “offline conversion” of sorts, it’s important that this behavior is reflected in our data. For this we use interactive Google Analytics events.
See, Google Analytics actually factors two types of page interactions into your bounce rate: page views and events.
Every time a visitor lands on a page that is a page view, or a page hit, but as shown above, sometimes there important engagements on page. In fact, in our example, unless the user converts and goes to checkout, it’s probably best that they simply interact with on-page elements. Since we run really targeted traffic, it would be a bummer if they landed on this sales page and simply went over to the home page or the blog.
Therefore, we need to set up events in Google Analytics to measure meaningful user behavior.
Events in Google Analytics and How They Affect Bounce Rate
Events can be used for a variety of actions like link clicks, form field completions or failures, popup impressions, carousel interactions, video plays, scroll depth, and more. Depending on your business goals, you could use any one of these and more to bring granularity to your behavioral analytics data.
Note that you can also set events in Google Analytics as nonInteraction. This means that, when the event is triggered, it doesn’t mess with your bounce rate, and Google Analytics doesn’t consider it an engagement hit. That’s important, too, as if you have event that shouldn’t be interactive, you might be achieving 0% bounce rates (never reflective of reality, unfortunately).
When you read many articles on reducing Google Analytics bounce rate, changing the way bounce rate is measured is what they’re talking about – not changing user behavior. This, in many circles, is known as an “adjusted bounce rate.”
It’s the process of changing the definition of bounce rate from the default (a bounce is when someone just visits one page and leaves) to something more meaningful to the business (a bounce is when someone visits one page without interacting with our form or watching the promotional video).
How to Analyze Bounce Rate in Google Analytics
Once you have your definition of bounce rate in Google Analytics set and agreed upon, there are a variety of ways you can use bounce rate to make business decisions.
One of my favorite ways to use bounce rate is for conversion optimization research. Essentially, when we’ve implemented things properly, we can use bounce rate as a proxy for success on similar landing pages.
And it’s quite easy to pull this report.
All you do is go to Behavior > Site Content > Landing Pages and use the comparison feature on the right hand side of the screen. Then select Bounce Rate from the drop down menu like I showed above:
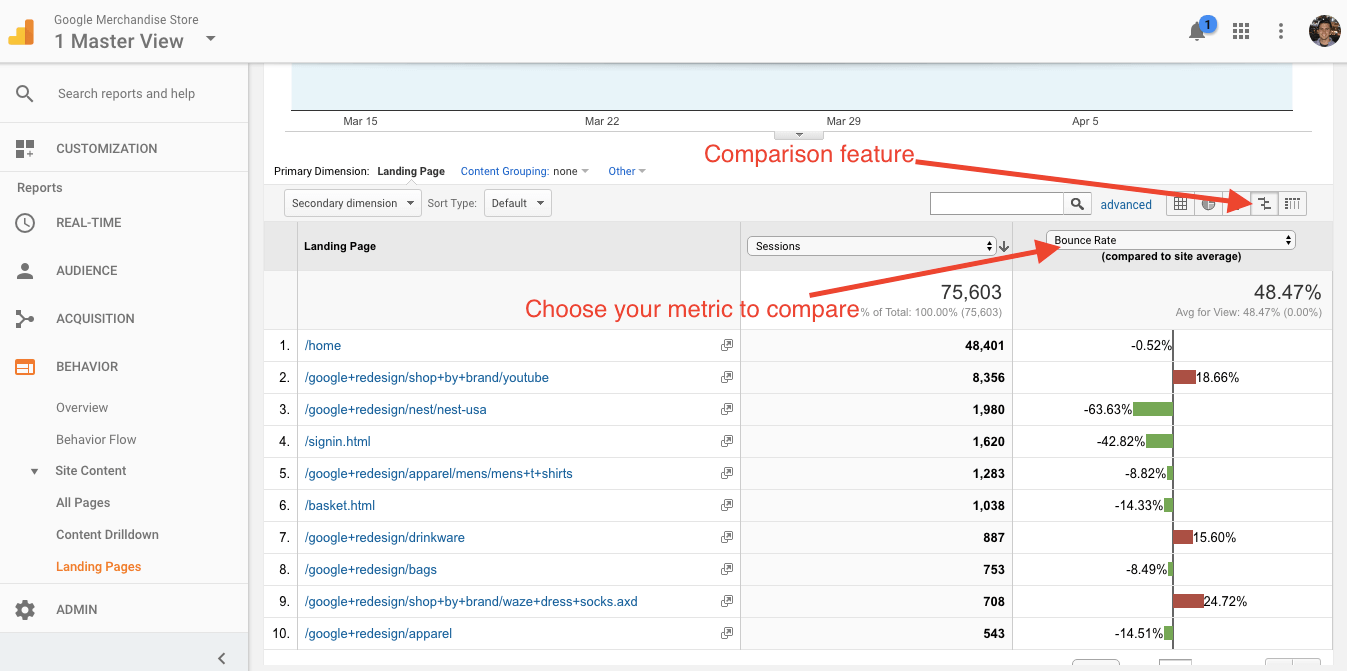
This shows you all pages, but it’s likely that you’ll want to get more granular. For instance, if you have product category pages, you can narrow down and see the Bounce Rates of only pages in that category. That way you can view similar pages and get a better contextual idea of bounce rates across your landing pages.
Just search your category indicator, e.g. “drinkware,” and you’ll see only those pages and can nail down which ones need work:

Note: you can also compare other metrics, like Goal Conversion Rate. The point is the comparison feature. Instead of guessing which pages to start optimizing, you can see which ones are over and under-performing against the site average for that particular metric.
When you’re prioritizing A/B tests, no matter which framework you use, it’s likely that one input you use for prioritization is “impact.” This usually comes down to how much actual impact, or potential, the test could have.
Well, those with lower than average conversion rates and also high traffic represent the biggest potential impact. There’s a lot of room for improvement on these pages, and because they’re higher traffic, the impact is larger than the marginal increases in value you’d see with lower trafficked pages.
Conclusion
Google Analytics bounce rate is quite often misunderstood, though with some proper strategic thought and technical implementation, you can use it to understand your website’s performance at a much granular level.
Just remember to think about what a meaningful website interaction is for you, and then begin to plan out Google Analytics events to track these.
Once you’ve got things in place, you can then use bounce rate in Google Analytics as a sort of engagement metric to analyze landing page performance and more.
Read Next Lesson or Download guide as PDF
-
Bounce Rate in Google Analytics
Since Google Analytics is far and away the most popular web analytics tool, it pays to know exactly how bounce rate is calculated in Google Analytics. -
Bounce Rate Benchmarks: What’s a Good Bounce Rate, Anyway?
"What's a good bounce rate?"...common question, not a super clearcut answer. This piece will explore bounce rate benchmarks and give you a good baseline understanding of where you may stand. -
Email Bounce Rate: How to Manage Soft & Hard Email Bounces for Better Performance
While most people think of bounce rates in terms of website analytics, email bounce rates are a thing, too. -
The Top 4 Ways to Lower Bounce Rate
Now for the meat of the guide: how do we lower bounce rates? -
The SEO Impact of Bounce Rate (What You Need to Know)
Does bounce rate affect SEO? Some say yes, some say no, but this article spits the truth of the matter. -
Bounce Rate vs. Exit Rate: What’s the Difference?
Unfortunately, the two metrics are often misunderstood and used interchangeably, when it is their subtle differences that make them useful metrics. -
Conclusion
Summary and wrap up.