Average click-through rate (CTR) is the ratio of clicks on your link to impressions your link makes. Since it is an average, it looks at the CTR of your overall campaign rather than for each individual keyword.
In this way, it serves as a good summary picture, but also hides specifics such as which keyword phrase you rank better for.
There are many reasons why marketers seek to optimize their CTR and why it is one of the most important metrics to monitor in regards to PPC advertising.
For one, a high average CTR indicates your link and/or ad is drawing attention and traffic to your site. This means more audience for your offer.
Google, for example, relies on your historical CTR data to predict and estimate your future CTR. Depending on how high or low your CTR is predicted to be, your Quality Score and Ad Rank will change. Check out “PPC Click-Through Rate” for more information on how CTR affects your ad placement.
More importantly, average CTR is a good indicator of performance. If you have a low CTR, for example, it may be an indicator that your copy or headline isn’t effective or that you are targeting the wrong audience, reaching the wrong demographics, or spending money on the wrong keywords.
However, CTRs are also affected by a range of other factors we can’t necessarily control such as your industry, channel, target audience, etc. The inevitable next question becomes: “What is a good click-through rate?”
Unfortunately, this is a tricky question to answer.
This article will explore benchmarks by industry, ad format, ad position, and channel to help you place your CTR amongst like competitors and discuss how to set a baseline CTR. Lastly, it will discuss the implications of having a high CTR.
Table of contents
CTR Benchmarks by Industry
Average CTRs vary by both network and industry. The following chart displays metrics from Datawrapper on the average CTR by industry on both the display network and the search network.
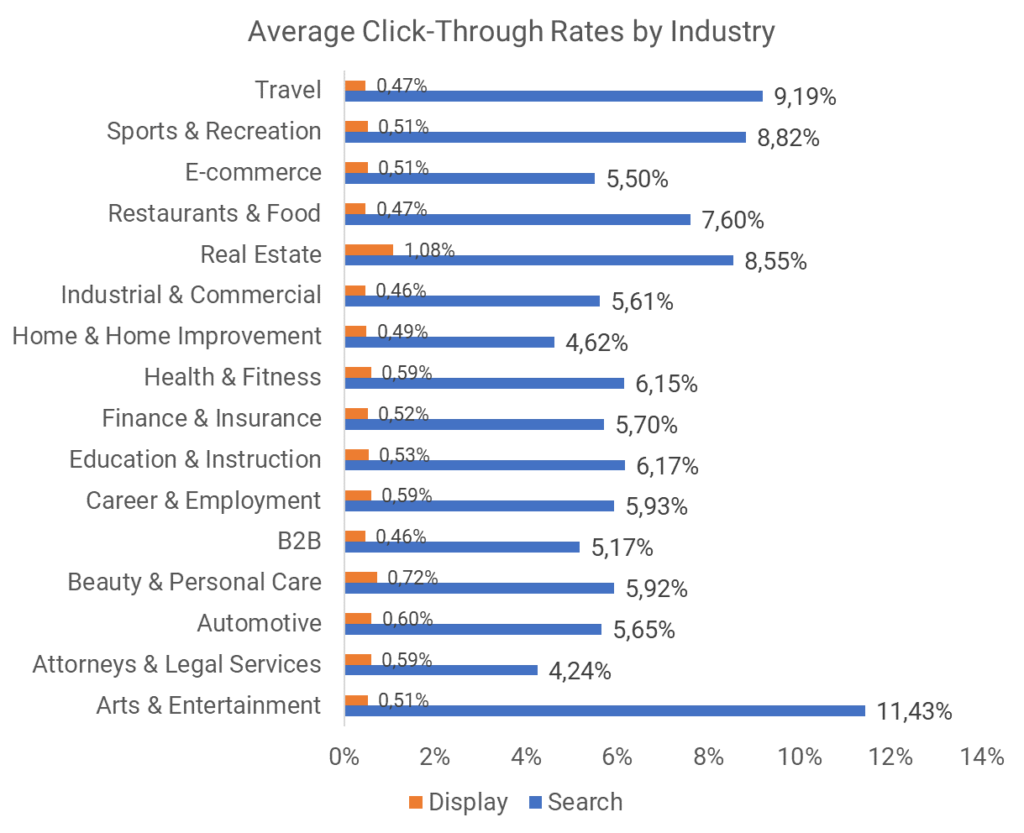
And here’s the same data in an easy-to-read table:
| Industry | Average CTR (Search) | Average CTR (Display) |
| Travel | 9.19% | 0.47% |
| Sports & Recreations | 8.82% | 0.51% |
| E-commerce | 5.50% | 0.51% |
| Restaurants & Food | 7.60% | 0.47% |
| Real Estate | 8.55% | 1.08% |
| Industrial & Commercial | 5.61% | 0.46% |
| Home & Home Improvement | 4.62% | 0.49% |
| Health & Fitness | 6.15% | 0.59% |
| Finance & Insurance | 5.70% | 0.52% |
| Education & Instruction | 6.17% | 0.53% |
| Career & Employment | 5.93% | 0.59% |
| B2B | 5.17% | 0.46% |
| Beauty & Personal Care | 5.92% | 0.72% |
| Automotive | 5.65% | 0.60% |
| Attorneys & Legal Services | 4.24% | 0.59% |
| Arts & Entertainment | 11.43% | 0.51% |
If you’re wondering what the average click through rate is, looking at all industries shows an average CTR of 6.64% for search and 0.57% for display. A CTR higher than the data showed in the table above for each industry can be considered a good CTR (or, at least, higher than average).
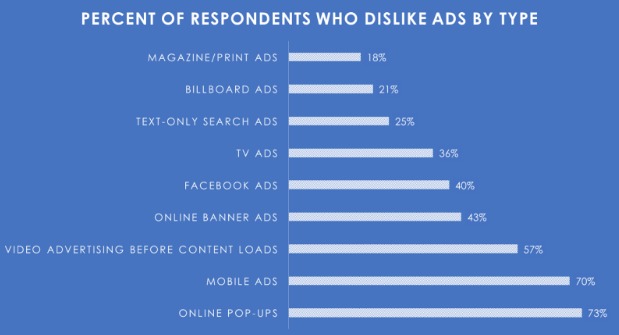
Note the difference in average CTR between search and display data: this occurs because users on the search network are actively searching for content related to the keywords they submitted whereas users viewing ads on the display network skim your ads passively, usually with no intent to click. In fact, many users will find ads on the display network annoying to their overall viewing experience.
Data from HubSpot makes this point clearly, people dislike display ads a lot more than they do text-only search ads.
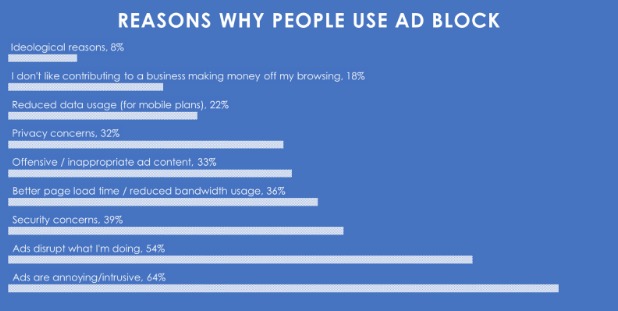
In fact, the default response from viewers when they encounter ads is to turn-on and/or install an ad blocker. Viewers may also use ad block when ads are disruptive, offensive, or concerning.
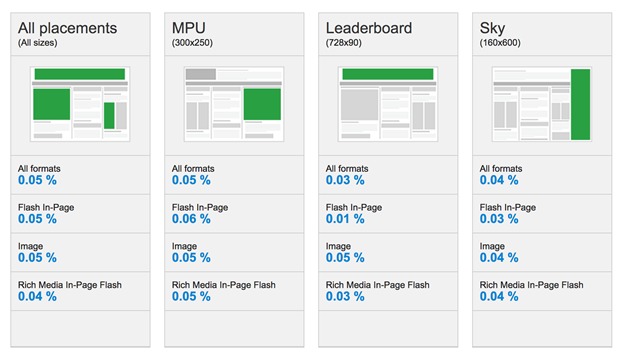
CTR Benchmarks by Display Ad Format
Of course, different display ads perform differently depending on their location on the page, their size, and even their media format.
Rich Media Gallery offers a benchmarking tool that shows you the average CTR for various types of display ads. Here’s a sample of their data:
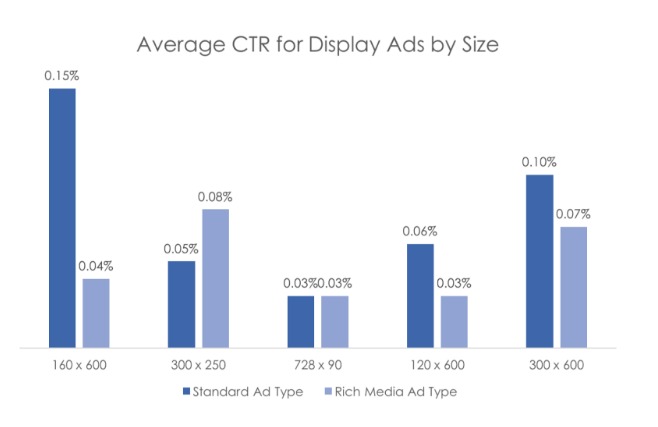
CJ Media’s Online Advertising Benchmarks Report reveals some other interesting trends, including data for how CTR varies by ad size.
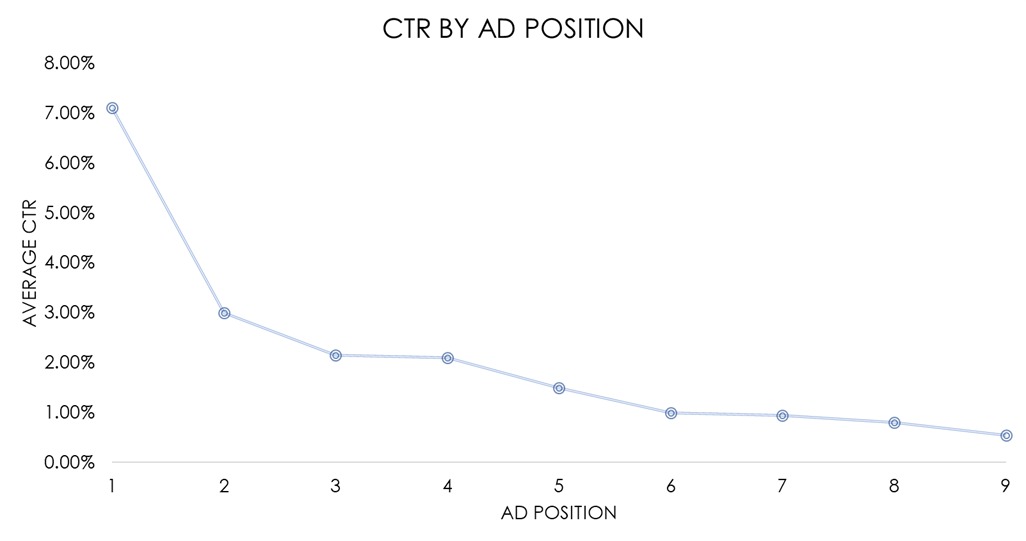
CTR Benchmarks by Ad Position
Your CTR is also affected by the position of your ad in the search results page. That means, even if you are in an industry with high average CTR, your CTR may be substantially lower if your ad does not rank. Similarly, if you are rank one for a keyword, you may find yourself with an extremely high CTR even though the industry average is low.
According to AccuraCast, the average CTR for ads in the search network varies dramatically by rank. Ads in rank one have an average CTR of 7.11%, while ads in rank nine only have a CTR of 0.55%.
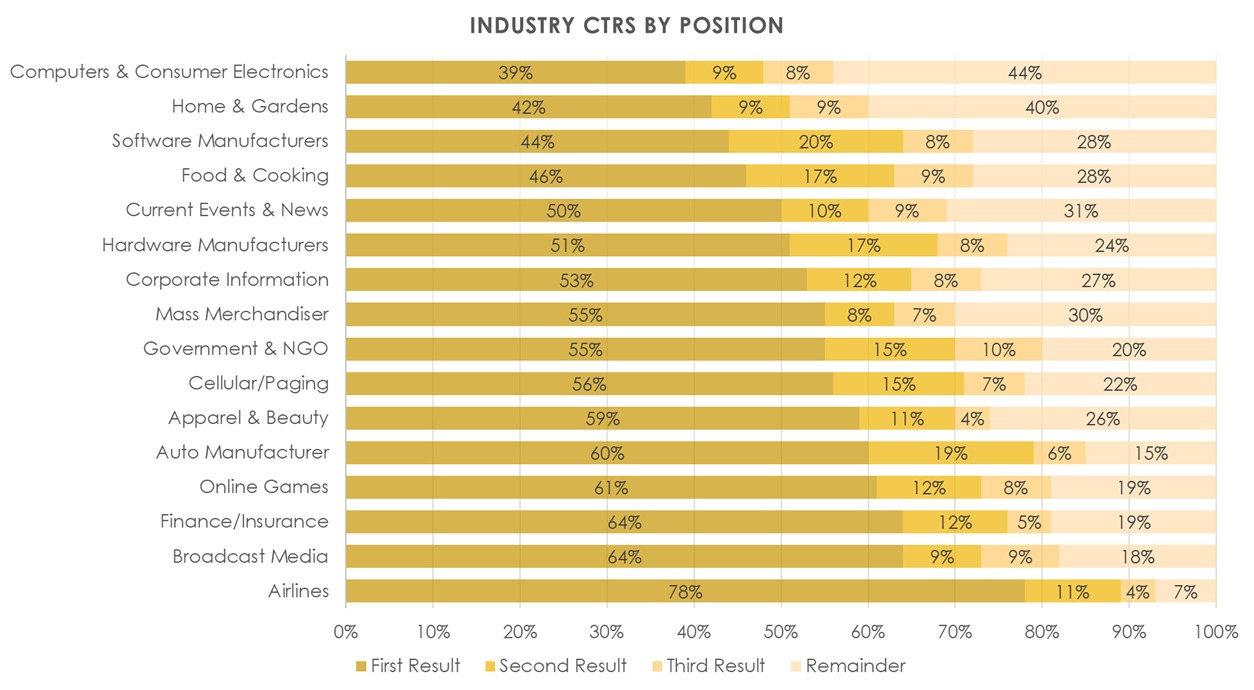
CTRs for natural search results reflect similar patterns. In fact, most clicks for searches across industries occur in the first three results. That means, most people do not even look past the first three results of a search.
CTR Benchmarks by Channel
Unsurprisingly, the channel you display your links on also affect click-through rate. Users on Google search, for example, are different than users browsing through Facebook feeds. Not only are there variations in purpose of session, but there are also variations in demographics and display format.
On average, Twitter ads have the highest CTR (2.00%) and LinkedIn has the lowest (0.06%). One reason for LinkedIn’s low CTR performance may be LinkedIn’s primary purpose as a networking tool and limited outreach opportunities for advertisers.
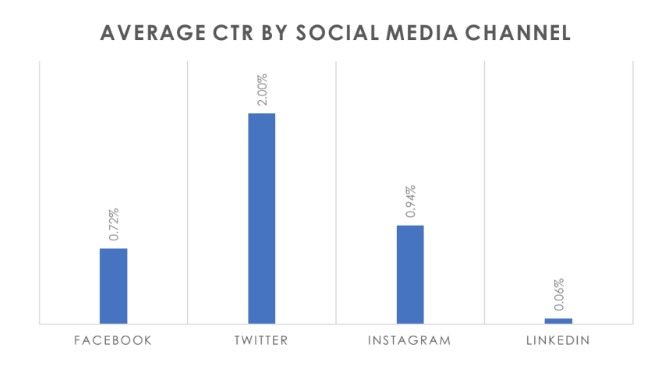
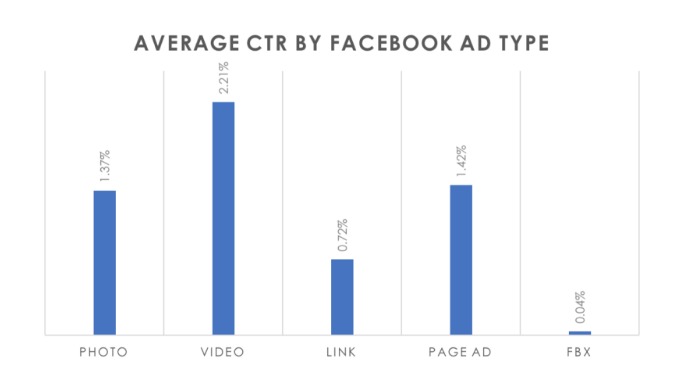
However, these averages cover up the specifics. Facebook, for example, offers multiple ad types. While its link ads only have a CTR of 0.72%, its video ads have a CTR of over 2%, beating Twitter’s average CTR, at 2.21%.
Likewise, CTRs for emails and newsletters are different than CTRs for search and display network content. According to MailChimp, CTR for emails is highest in the Hobbies industry (5.13%) and lowest in the Restaurant industry (1.25%).

For more discussion on CTRs for PPC social media channels and emails check out “Email Click-Through Rate” and “PPC Click-Through Rate.”
Setting a Baseline CTR
While this article focused on averages and benchmarks, it is important to determine your own baseline CTR and goal.
Rather than look at percentages, aim to incrementally improve your CTR.
In the end, there is no magical number, rather, each average supplied in this article is only meant to serve as a starting point for your own analysis of various CTRs for your campaigns.
To truly set a baseline, you’ll need to spend more time analyzing data.
You’ll want to use tools such as Rich Media Gallery benchmarking offerings to find specific data lining up to your industry, channel, ad type, ad position, and more.
More importantly, you need to track your CTR to see how your CTR various by (if it does) day, time, month. Twitter’s CTR, for example, varies by time of day. This will allow you to account for variations in data and track improvements.
Conclusion
In the end, there is no right CTR.
CTR is only one metric amongst many, and even after optimizing your CTR, you are bound to run into other issues. Focusing on CTR may even be detrimental as a high CTR on its own doesn’t guarantee much in terms of conversion rate, revenue, or other macro-conversion metrics.
For example, you may have a high CTR from bots, unqualified prospects, and uninterested customers.
Because it is difficult to track exactly which clicks are relevant and which aren’t, you need to watch out for your conversion rate and your ROI if you’re running an ad campaign. Only by considering how traffic flows after your prospects click can you determine if your high CTR is doing you favors.
Next lesson or Download guide as PDF
-
What is Click-Through Rate? Click-Through Rate Definition
What is a click-through-rate, actually? In one way, it’s a straightforward question, but on the other hand, it’s a metric that is used and abused by many different channels and in many different ways. -
What is a “Good” Click-Through Rate? Click-Through Rate Benchmarks
"What's a good click through rate?"...common question, no clearcut answer. This guide will cover industry and platform benchmarks so you can see where you stand. -
Email Click-Through Rate: What You Need to Know to Succeed
When you ask email marketers for the metrics they track, click-through rate (CTR) is likely to be one of their first answers. This article covers everything to do with email CTR. -
PPC Click-Through-Rate: What it Means and How to Use It (and Improve It)
Click-through rate (CTR) is one of the most important metrics you should be monitoring when implementing paid customer acquisition. -
The SEO Impact of Click-Through Rate (What You Need to Know)
How does click-through-rate affect SEO rankings? It’s a common question and debate in the optimization space. -
Click-Through-Rate vs Conversion Rate: What’s the Difference?
This article covers a CRO question: what's the difference between CTR and conversion rate and why does it matter? -
Conclusion
Summary and wrap up.