
Customer personas are often talked about in marketing and product design, but they’re almost never done well.
There are certainly companies doing them well, but not a lot of detail goes into instruction, and the blog posts out there on how to build personas are generally pretty bad.
I recently created robust user personas for CXL Institute (on inspiration from a course in our CRO certification program taught by Stefania Mereu and Eric Taylor), and it went well.
This post will outline the entire process, giving code examples, data analysis examples, survey questions—the whole thing. You should be able to replicate this process after reading it (or at least follow the resources in the article to learn more about specific parts).
Table of contents
- A quick primer on user personas
- Where marketers tend to go wrong with user personas
- A better way to build data-driven personas
- Step 1: Outline your goals and plan your approach
- Step 2: Write your survey and send it to your audience
- Step 3: Explore the data (Part 1: EDA in R)
- Step 4: Explore the data (Part 2: Pivot tables and Excel)
- Step 5: Explore the data (Part 3: Qualitative)
- Step 6: Organize the data into rough but distinct personas
- Step 7: Conduct one-on-one interviews
- Step 8: Put it all together and share with your team
- Important caveats
A quick primer on user personas
What’s a user persona? A research-based archetypal representative of your customer based on various attributes, attitudes, and characteristics.
One of the best definitions I’ve found, which expounds a bit more, comes from Tony Zambito circa 2002:

Tony Zambito:
“Buyer personas are research-based archetypal (modeled) representations of who buyers are, what they are trying to accomplish, what goals drive their behavior, how they think, how they buy, and why they make buying decisions. (Today, I now include where they buy as well as when buyers decide to buy.)”
The first mention of personas was in Alan Cooper’s 1991 book, The Inmates are Running the Asylum. Cooper framed personas as a way of avoiding designing for an “elastic” user, and thus cementing some sort of common properties across segments to aid cohesive design strategy. The alternative, an “elastic user,” would be a design target that stretches to the whims of the design team.
They’re also known as buyer personas, customer personas, customer profiles, or just personas depending who is selling the idea to you. They all mean the same thing, though.
Personas are essentially fictional representations of segments of buyers based on real data reflecting their behaviors. You use them to make better marketing, product, and business decisions and to keep your customer top-of-mind when doing so.
They can be utilized across teams—UX, CRO, social media, SEM, SEO, etc., can all benefit from a better idea of the customer.
Where marketers tend to go wrong with user personas
Not everyone believes user personas to be valuable.
They launched to much applause, but a few trends wore down their appeal with time. The first, according to Dr. David Travis at UserFocus, was agile development:

Dr. David Travis:
“‘Development’ teams morphed into ‘design’ teams. Engaging with users became more of a norm and less of an exception. This is good for user experience, but it’s bad news for ‘traditional’ personas.
Traditional personas began to look too finished, too final. Teams were savvy enough to know that fully formed, completed descriptions of users are an impossibility at the early stages of design. Instead, they wanted conversation starters.
To use the agile terminology, design teams wanted to get a ‘shared understanding’ of their users and they were suspicious of any attempt to set requirements in concrete.”
Another reason is a common one: marketers ruined it for everyone. Essentially, personas were largely a parody of themselves, with made up data (or irrelevant data like the eye color of a persona). They took on cheesy stock photos and cringey names like Big Spender Billy.

In addition, the adoption of personas by marketers led to distrust in the validity of the methodology by designers and developers. As Dr. David Travis put it:
Dr. David Travis:
“Marketing teams created versions of personas to represent market segments. Because they used the magic term ‘personas,‘ development teams were discouraged from developing their own, not realising that a market segment might contain multiple personas.
More cynically, the purpose of marketing personas is primarily to sell more stuff, whereas design personas need to reveal the user behaviours relevant for a product. Development teams couldn’t use marketing personas to make design decisions, so they decided personas weren’t that useful.
(It wasn’t helped by the fact that marketers seem fond of giving their personas silly names, such as “Social Butterfly Brenda” or “Value Hunter Valerie,” that attempt to collapse nuanced research into a single concept. This trivializes the research, resulting in designers rolling their eyes and shaking their heads.)”
The power of user personas fades when people don’t trust them or they aren’t based in reality. Generally, the big mistake marketers make with personas is treating them as a subjective projection of values on some useless canvas. More specifically, that tends to fall within five categories of mistakes:
- Making up data;
- Using too much irrelevant data;
- Using only qualitative data;
- Using only quantitative data;
- Believing your personas to be perfectly representative of reality, or that they never change.
You can also create too many personas (three or four is the recommended amount), but I don’t see that problem often. What I see more often is a persona created with no attempt to fit that model to reality, or no use case in actual business decisions.
Remember: your personas are only as good as the research behind them.
A better way to build data-driven personas
So how do we move past those mistakes and create trustworthy and actionable user personas?
There are many methodologies out there. I want to note now that the way I did it is not the only valid way. It might not even be (and probably isn’t) the most sophisticated way. But it’s fast, effective, and data-backed.
Even better, anyone can do it—and usually in under four weeks. That allows us to move quickly and maintain an agile product design strategy as well as an agile marketing strategy. We’re not rendered complacent by too much research.
It’s based on a combination of qualitative and quantitative data, of exploration and analysis. You’ll walk away with personas you can use for marketing decisions, as well as data to further explore for copy ideas, design guidance, and marketing experiments.
Step 1: Outline your goals and plan your approach
What do you want to know? Plan your audience in this step. Who will you survey and how will you reach them?
This also presupposes that you have a certain level of user knowledge, i.e. you’re not starting totally from scratch.
We did an analysis quite a long time before in Excel to find our most valuable customer segments, and we use Intercom to trace their common behaviors. We never did a full structured analysis on behavioral correlations (e.g., running regression analyses against success metrics), but we knew what our “ideal customer profile” looked like for the most part, and we knew which customer profiles were worth the most money to us generally.
Step 2: Write your survey and send it to your audience
Writing the survey was one of the hardest parts for me. It involved thinking about what my goals were with the project and tying those into questions that would produce actionable answers. Not only that, I wanted to remove bias from the questions and also keep the survey short enough that people would actually take it.
If I could go back, I’d actually improve my survey questions a bit. That’s where the data comes from, it’s the part you should focus on most. Measure twice, cut once here, and get your team involved if you can.
We used Typeform to send the survey. Here’s a section of the actual questions:
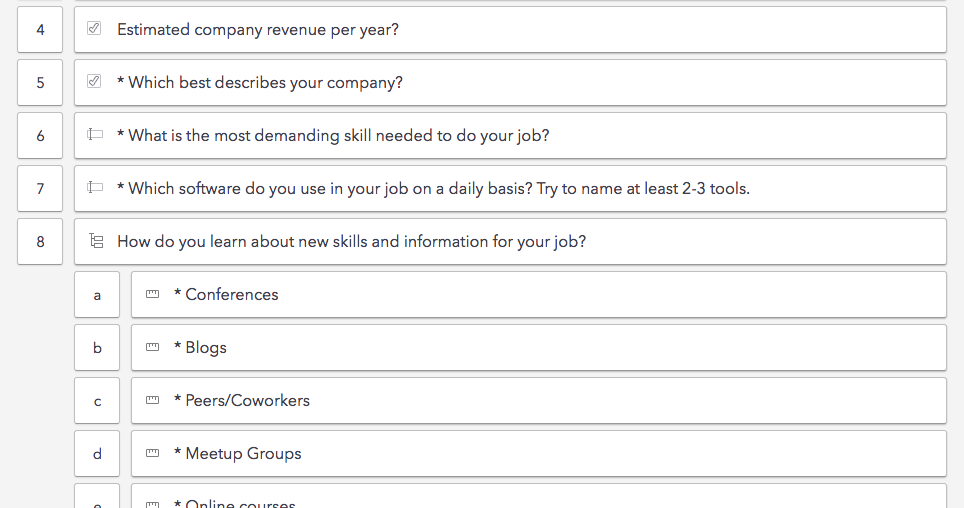
Some were categorical questions like “Which best describes your company?”
Others were scale questions like “When purchasing digital marketing training, how important are the following factors?” followed by a series of factors like “cost,” “reputation of instructors,” and “interactivity.”
And we also asked a few open-ended questions like “What’s the most challenging skill used in your job?” and “What blogs do you read regularly?” These ended up being the most valuable, in my opinion, for actionable marketing campaign ideas.
Small note on incentivization: We also wanted to incentivize people to take it, and did so by offering a free gift. Our specific play ended up being a logistical headache, so long story short, do what you can to get people take it without a one-for-one gift. The data is valuable, though, so find a way to get quality data.
Step 3: Explore the data (Part 1: EDA in R)
Let the data roll in.
Once you get about 300 responses, you can think about analyzing the data. You did plan ahead on your sample size, though, so that’s arbitrary. Again, 300-1,000 respondents makes for good data. You can do it with 150, probably. There’s no magic number here, as there are many moving pieces (survey quality, audience targeting, your own data analysis skills) that matter more than pure sample size.
You data will look something like this when it all comes in:
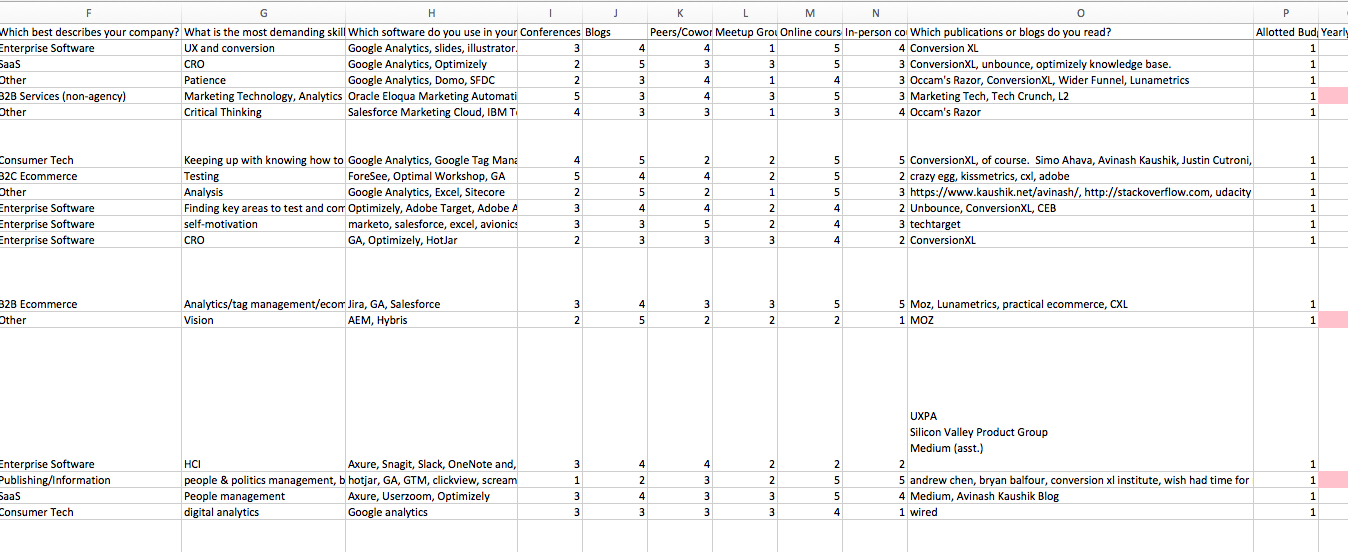
It needs to be organized the right way, with columns as survey variables and rows as responses (or observations) to analyze correctly. You can’t have blank cells (NA values). There are ways to remove or fill these cells within Excel or in R, or whatever statistical tool you use.
For this part, we’ll break into exploratory data analysis in R. If you use a different statistical programming tool, that’s fine. If you don’t use any of these, you’ll miss out on this level of analysis, but you can still use the data you’ve collected to build pretty accurate personas (more accurate than most companies build).
First thing we’ll do is exploratory factor analysis. The goal here is to identify the underlying relationships between variables (specifically, columns/survey questions). Basically, can we find factors that predict how people will answer certain questions?
There are many ways to do this in R, most commonly the out-the-box factanal() function. Another popular way is “psych” package, as outlined in this blog post.
I didn’t get much out of factor analysis, but I did find some patterns in three factors, though they didn’t explain much of the data’s variance. So I explored principal component analysis, which is similar and often confused with factor analysis but conceptually different.
I wanted to see if plotting it would clear things up. Here’s the code in R for that (where x is your data frame):
pcanalysis <- prcomp(x, scale = TRUE, center = TRUE)
plot(pcanalysis)
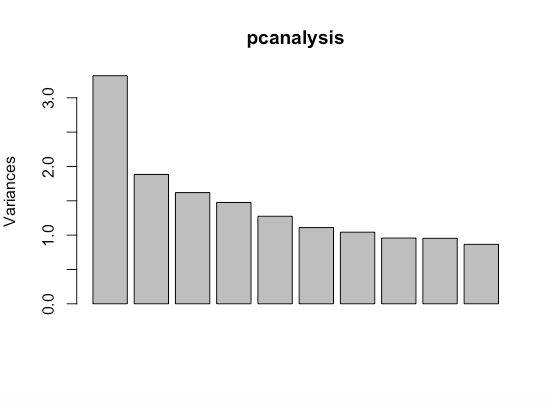
What this means is there’s one component that explains a decent amount of the variance in the data but it sort of fizzles out after that.
There’s more to talk about with PCA (and factor analysis), but I’ll keep it concise for the practical purposes of this post. Here’s a good explanation article if you want to read more.
After this, I went into clustering, which is like PCA or factoring but attempts to group data according to observations (the survey responses, or rows in your spreadsheet). This is the bread and butter for us when we want to find distinct user personas, as it separates our respondents into chunks based on how they answer things.
First thing’s first, make sure you scale and center your data if you have certain variables that are much larger than others (we have answers on a scale of one to five, but also employee counts that go into 50,000+). Here’s basically how I created scaled and centered data and did hierarchical clustering:
scaledpersonas <- scale(personas123, scale = TRUE, center = TRUE)
d <-dist(scaledpersonas)
c <- hclust(d)
plot(c)
This produces a dendrogram, which is a tree diagram used to illustrate the arrangement of the clusters produced by hierarchical clustering.
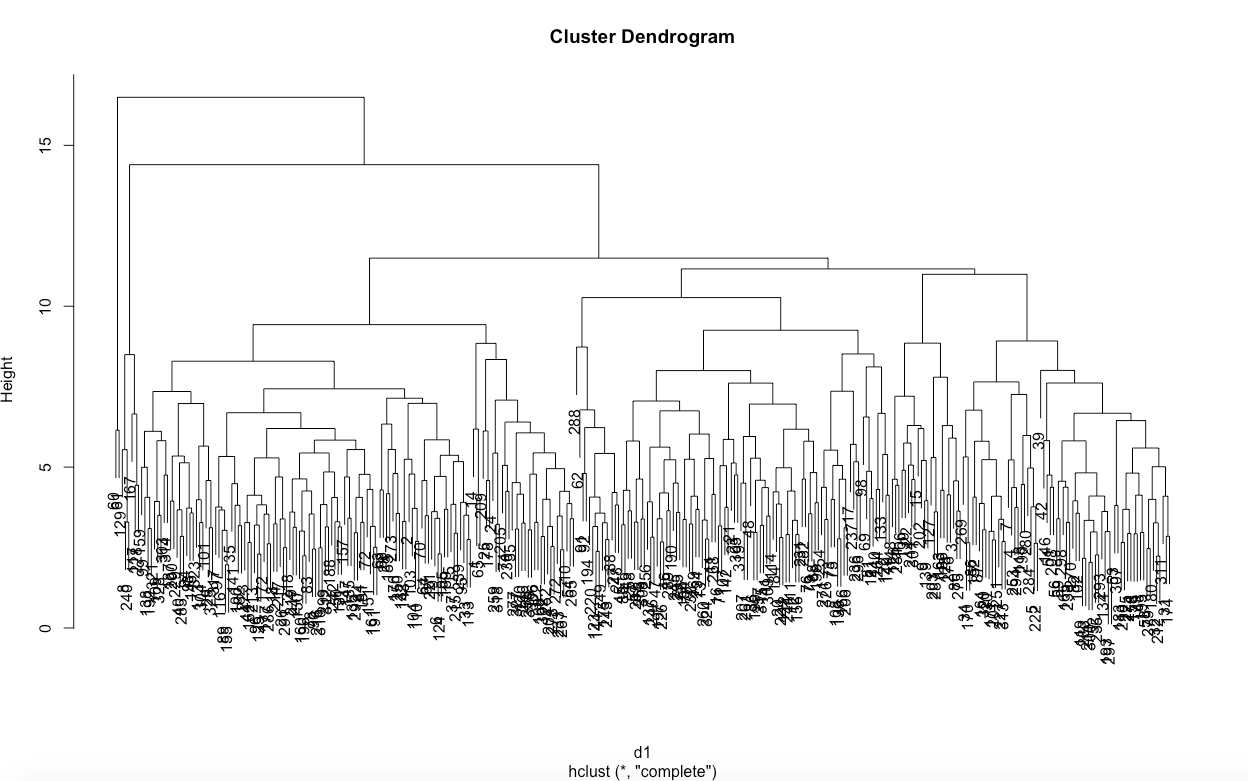
This was pretty messy, though it showed a few high level clusters, and one a few levels down that had many common values.
I moved onto a k-means cluster technique, which allows you to pick the number of clusters you’d like before you do the analysis. We wanted to explore what our clusters looked like with three to five personas. Here’s with three:
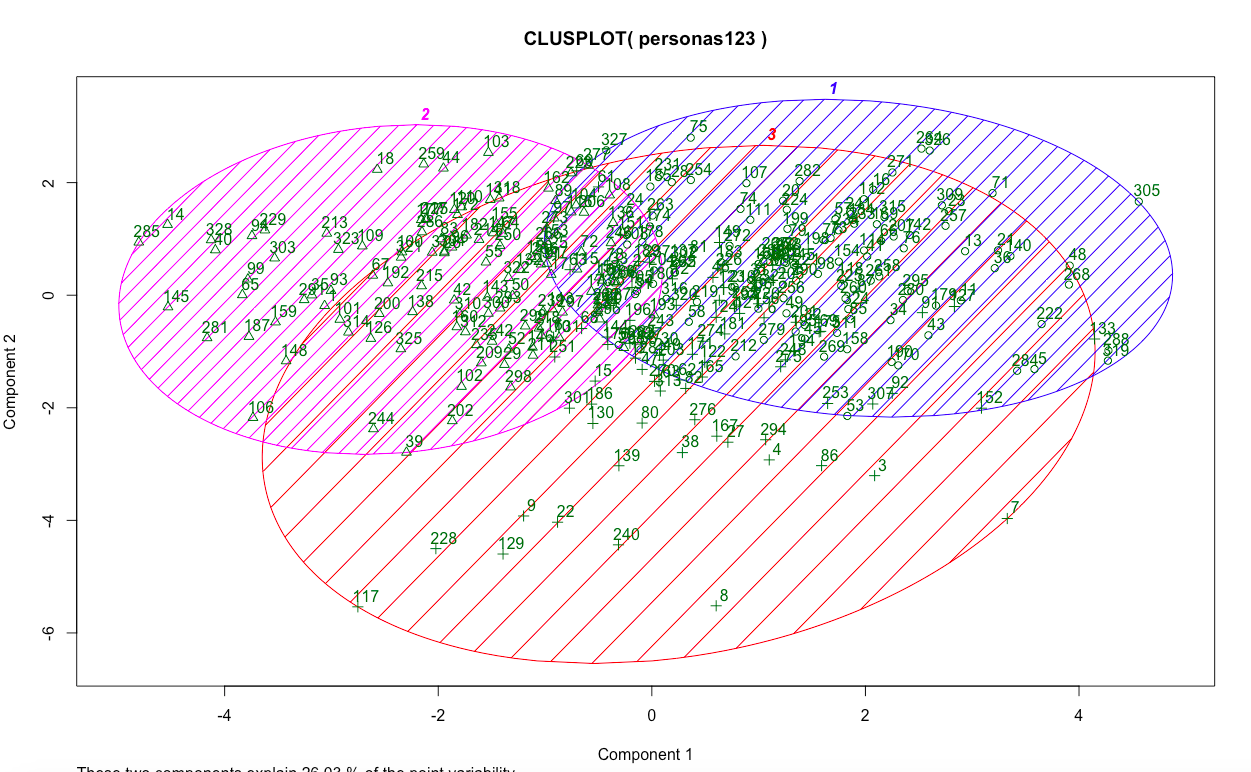
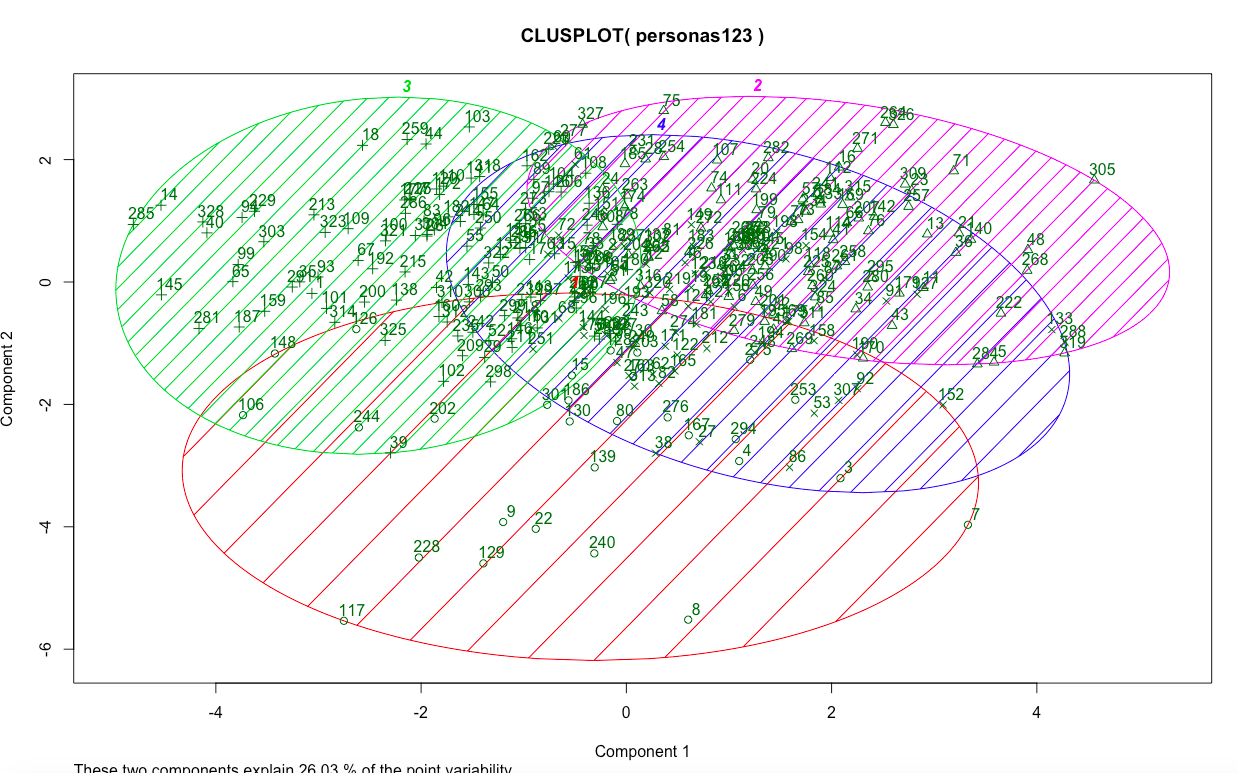
Looks pretty decent. Lots of overlap in the middle (due to common responses to what now seem like obvious variables like the importance of the reputation of instructors), but some uniqueness as well. Much better than with four clusters:
Here’s how I created that data by the way:
kmscaled <- kmeans(scaledpersonas, 4)
km <- kmeans(personas, 3)
kmscaled
And the visualizations:
require(cluster)
clusplot(personas,
kmscaled$cluster,
color = TRUE,
shade = TRUE,
lines = 3,
labels = 2)
Clustering was more fun. There were pretty clear cut clusters, and at the very least I could explore some of the observations individually to see what set them apart (in Excel).
Doing that allowed me to open up a whole new area of data analysis because I knew that the personas were largely segmented based on a couple variables (mainly company revenue, yearly training spend, and the importance of two to three variables when it comes to training). I could throw down some pivot tables to explore the rest and see where clusters differed in terms of the attitudinal questions, and if there were any variables I was missing.
Step 4: Explore the data (Part 2: Pivot tables and Excel)
You know how to work a pivot table, right?
Pivot tables are a stupidly simple yet incredibly powerful feature in Excel, and totally invaluable for data exploration. They’re a bit hard to explain without actually seeing one in action, but they essentially let you interactively explore data from different angles by placing different variables in columns/rows and analyzing averages, standard deviation, sums, etc.
For this project, they were wonderful, because I was able to set up different worksheets with respondents that fell into each cluster from the analysis above, and see how they answered various survey questions.
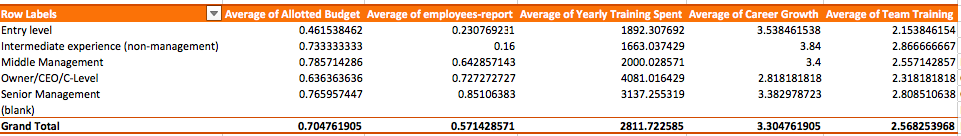
As you can see, then we could compare the means of different variables as a function of things like job title, job experience, company size, or even whether someone has an allotted and planned training budget.
I did this across personas (from clustering) and compared the means of different variables to find key differences. I also explored other factors, such as the those in the top 15% of reported yearly training spend, or those with allotted budgets vs. those without, to find common and different data between them.
It’s hard to really give a step-by-step here because it’s just part of the “insight generation” process. You have an idea of data you’d like to explore, a hunch of where you might find some interesting information, and you explore those factors. As I’d mentioned, we already had a lot to look at with our statistical clusters and a pretty good idea of our current customer makeup (and which ones were the best customers generally), so it wasn’t a hard process of building reports and pivot tables.
In fact, it was fun!
You can also make pivot tables that contain more than one row variable. Here’s one I just made that shows the average rating of how important cost is by 1) type of company and 2) seniority of employee:
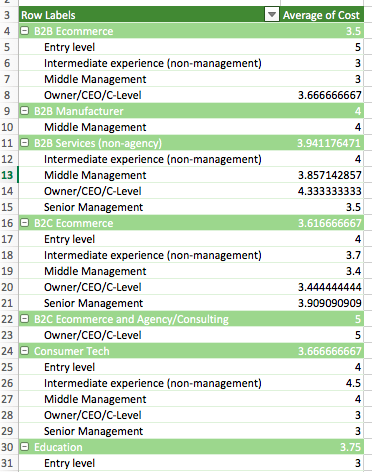
Some of them turn out not to be incredibly valuable (the above being an example of that), but there’s not really such thing as wasted time here, especially if you’re just learning. Spend a lot of time exploring the data. Look for surprises, things you didn’t expect. This isn’t a clear “do this in the following order” process, unfortunately.
Step 5: Explore the data (Part 3: Qualitative)
As part of our survey, we also asked some open-ended questions:
- What blogs do you read?
- What is the most challenging skill you use at your job?
- What software do you use on a daily basis?
- What’s the last training you completed for digital marketing?
These ended up being the most valuable for a variety of reasons, not least of which is the actionability inherent in the questions we asked.
For example, if we can segment by personas and find common blogs that each persona consumes regularly, we know where to guest post, advertise, or build partnerships.
If we know what software they use, we know who to partner with for events, webinars, and content, we know which tool-specific courses to teach, and we can even do some sales development campaigns based on software segmentation.
More than that, what blogs they read and what they consider their most challenging task tells a lot about who they are.
To start with, the data will likely be a mess. People will write “Google Analytics” where others will write “GA” and there will be a lot of discrepancies like this.
So do what you can to clean up this qualitative data. If you’d like to quantify the information, you can codify the answers (Adobe Analytics and Google Analytics both go under “analytics” category, etc.).
There’s a whole body of literature out there on qualitative data analysis. If you’re curious, look into it (we have a course on it in our CRO certificate program). If not, be scrappy and use the data to inform your personas.
We used the same persona segmentations we’d discovered via the last two (quantitative) steps, cleaned up the data (as best as we could), and built word clouds to get a high level view of what people were saying:
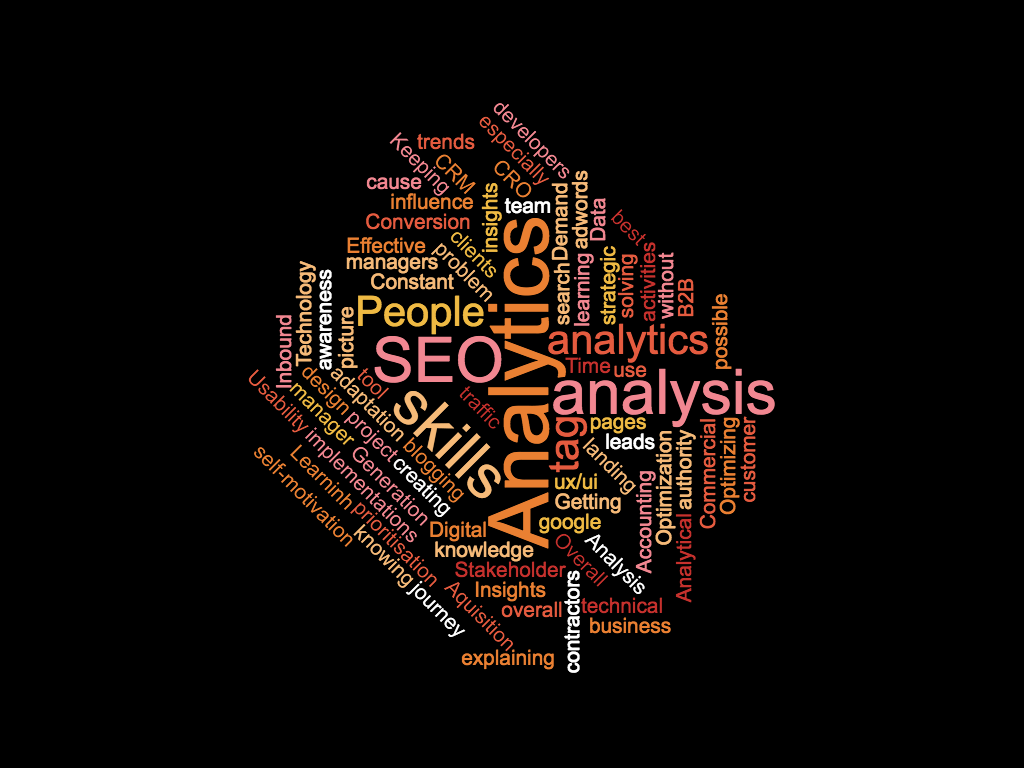
This step will help you cement the qualitative differences between your personas. It’s actually not a bad thing if they all read the same blogs, or they all fall under similar job titles, or whatever your open-ended questions produced. But if they’re different, you can infer different information about them.
One of our personas was incredibly interested in CRO blogs like ours, Unbounce, and Optimizely. Another was filled with general marketing content like Fast Company, HubSpot, and Inc. Another was a hybrid of CRO stuff and analytics-focused stuff like Occam’s Razor. Easy for us, these lightly corresponded with the quantitative segmentation we found as well, and sure enough, this information will help us with marketing and advertising in the future.
Step 6: Organize the data into rough but distinct personas
At this point, you know your data like the back of your hand. You go to bed thinking about which pivot tables you can create to pull new insights, and you’ve got an idea of how your personas break down in reality, not just how you wish they would look.
It’s at this point that you start to crystallize them into distinct personas. Find their core values. Maybe you found one persona clusters around survey components that emphasize value (over quality and whatever else), they read X blogs, and they make more money than the average respondent, but spend far less. These details begin to form a distinct persona.
What you have here is almost finished. In fact, if you’re really lazy and don’t want to do one-on-one interviews, you can be finished (you should do one-on-one interviews, though). At this point, you can fully segment your users based on any information you asked for on your survey (see why early I said the survey creation is the most important part of the process?).

We had three pretty clear personas at this point. I won’t go into too much detail, but the loose personas were those who wanted to grow their business and have an edge on the competition, those who were ambitious self-learners and were determined to be top 1% T-shaped marketers, and those who managed teams and wanted structured education (and clear ROI and progress tracking).
From there, we found some prototypical customers who very closely resembled the fictional personas we’d created and asked them to spare 15-20 minutes for a one-one-one phone interview.
Step 7: Conduct one-on-one interviews
I’m a marketer, so I’m primarily interested in insights I can use for growth and advertising. However, I had also done a behavioral analysis (in-app) of our customers previous to setting up the user persona research, and I work closely with our product team. They also conduct customer interviews, so I roped them into this to kill two birds with one stone and share data across teams.
We planned a series of questions that could aid both product and marketing. They’re deliberately open-ended and designed to spur emotion and depth:
- What’s your role at your company? Explain at high level and day to day.
- Career background?
- How big is your marketing team? How are they organized and distributed? Who do you work with on a daily basis?
- How does your company organize training and ongoing education?
- Is training individually motivated or assigned to you?
- Who in your company found CXL Institute? How did you find it?
- What makes you feel successful when using the Institute?
- What made you sign up?
- What’s the single biggest challenge at your job?
- What are you motivated by? What keeps you up at night?
- Say you have a genie, and you could magically develop one skill in the next few years, what would you wish for?
- Do you use, or have you ever used, a training tool like the Institute? If so, which ones?
- IF you have used similar tools, how did they compare in quality and style to the institute?
- Whose advice do you trust? Who do you follow or ask when you have a challenge?
These questions represent a template. In other words, this isn’t a checklist, it’s a conversation. Take a journalist’s attitude and go into the conversation with a sense of curiosity and exploration. The point is to make it feel unlike an interview and more like a conversation with a close friend.

You don’t want surface level answers, shit you can look up in your product analytics.
You want soul-baring answers about their fears of looking inferior in front of their coworkers, their motivations about growing their business to $100M a year in revenue, or their assertions of the thought leaders they trust and why they think most of the industry is full of hucksters, but not you.
If you do this right—and there’s a whole art to it—it should be one of the most insightful parts of the process. It’s really the ornamentation on the foundation; you’ve already got the basic personas segmented on attitudinal and behavioral data, and now you want to find emotional triggers to help you with messaging strategy, emotional targeting, and design.
This stage should take a few days to a week, depending on how quickly you can organize and conduct these interviews (we did ours in a week). Try to get two to five interviews for each distinct persona.
Step 8: Put it all together and share with your team
That’s it. You’re done. Quick and dirty user personas, in only three to four weeks. And you can actually use them.
Design them and communicate them so they actually get shared with the team and used for decision making. This is where you can get creative (there’s no one way to do this and certainly no prototypical template). Here’s an example template I really like from buyerpersona.com:
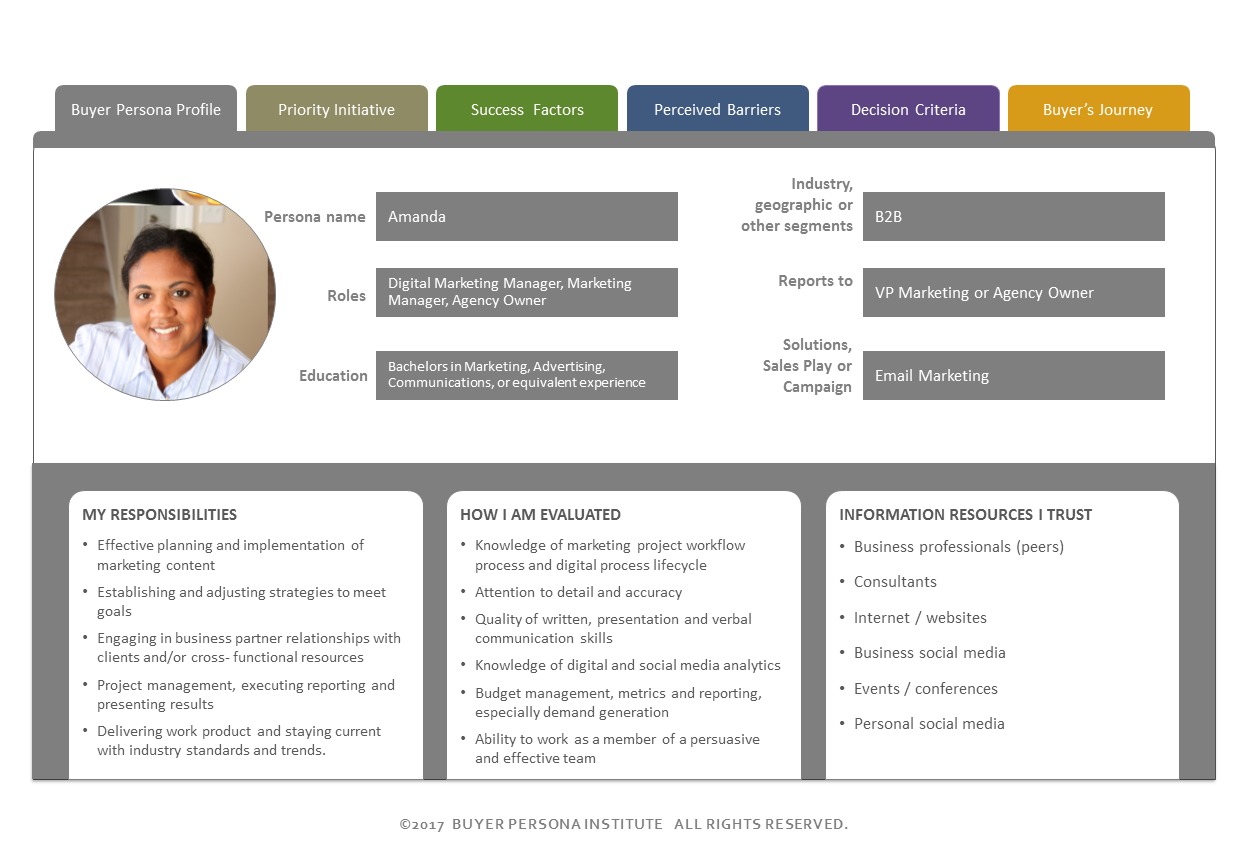
I think this example provides the most granularity and actionable information, while also segmenting the information with tabs.
Here’s one from Smart Insights:
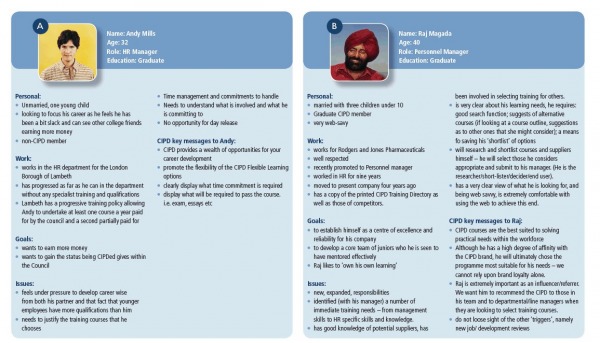
I don’t think there’s necessarily a right or wrong way to do it, so long as you concisely include actionable information and communicate it effectively. These things should live on their own and not need further questions from teammates who haven’t seen all the raw persona data
You can also map them out on GE/McKinsey’s Matrix. This shows you how ideal the customer persona is vs. how strong your business case is for them, allowing you to visualize where the best opportunities are for future marketing efforts:
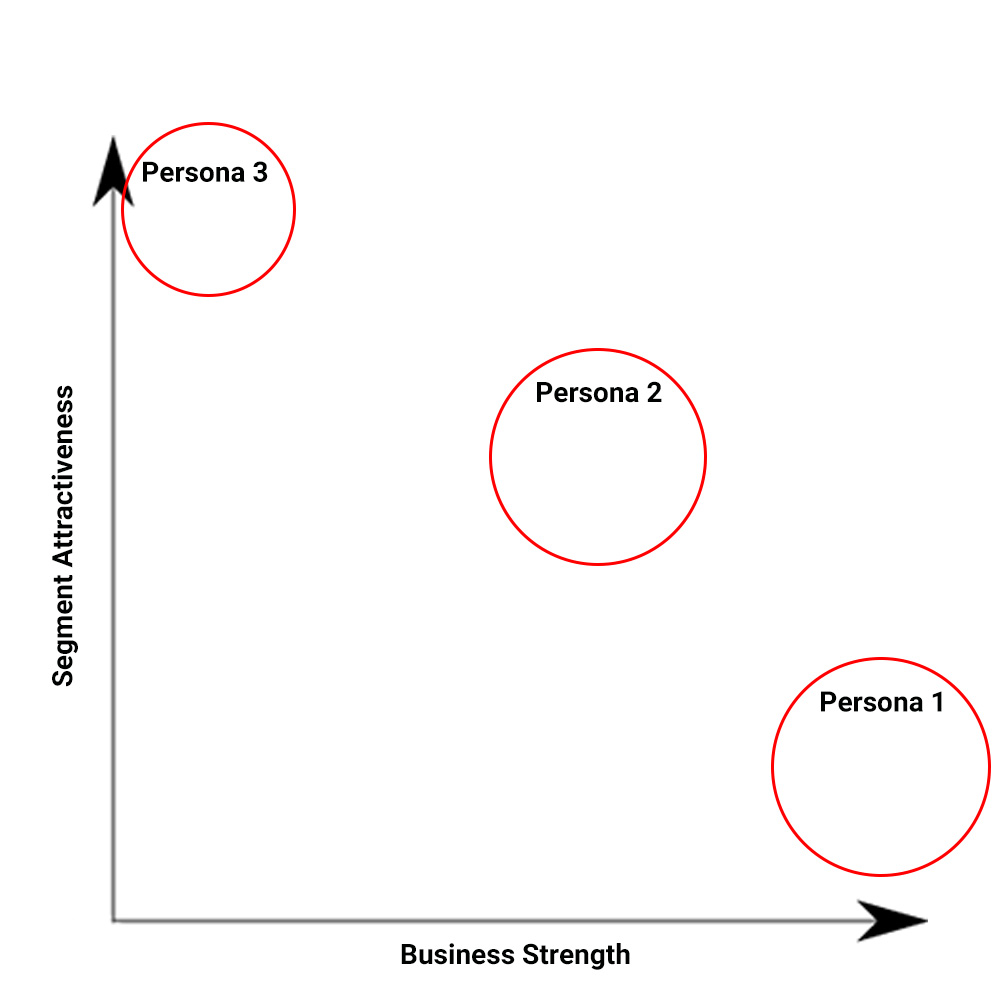
The top left (Persona 3) means they’re our most ideal customer but we are executing the least effectively on selling to them, and the bottom right (Persona 1) means we’re selling to these people the best but they’re not the most ideal for our business. The opportunity then is in Persona 2 and Persona 3.
After this is the fun part: execution. Just because you have a pretty poster on the wall with your hard fought and researched user personas doesn’t mean you’ve actually done anything. All of that research is wasted if you don’t use it. If it doesn’t aid design and product decisions, you’re doing it wrong. If you don’t change a thing about your marketing, you’re doing it wrong.
Important caveats
A few notes:
- This is not the only way to make user personas. There are tons of ways. There’s also not a lot of research on which method is more effective, but I tend to side with the one with more objectivity, less conjecture, and more rigor/structure. That’s why I like this approach.
- This approach also still leaves some factors up to subjectivity. In ours, we knew that while persona 3 represented a smaller portion of our current audience, they represent the highest value customer segment. So we wanted to keep them as a persona, regardless of their lower representation in this set of data.
- Just because you make them doesn’t mean they’ll be effective. You have to first decide your goals in making them. What will this information let you do differently?
- This is a fluid process. As you learn more about your customers, you can tweak or change your personas. You should. A static persona isn’t just lazy, it’s almost certainly unrepresentative of your customer because 1) you never have all the data you need at one time, and 2) your customer profile changes with time.
I’ve heard it recommended that you should update your personas once every six to eight months or so. We’ll do it once a year. You do what works best for your organization, but keep it evolving and improving.
Conclusion
This is a lot of information, but if you take it step-by-step, building accurate data-driven personas isn’t hard (and it can be accomplished in under a month).
Realistically, you don’t need to do everything I outlined. Especially if you’re just starting out and haven’t really discovered Product/Market Fit, you shouldn’t be investing this much into personas because they won’t mean anything.
We’ve hit a point of traction and have defined customer profiles. Adding user personas that are backed by quantitative and qualitative data helps us produce landing pages, design, and messaging, as well as product development roadmaps and targeting and partnership ideas. It truly adds a level of depth to our marketing and adds value.
Even if you’re at the level where building personas will help your marketing, you can likely skip clustering and PCA if you don’t have an analyst willing to do that. Plus, those methods tend to be less clean than they seem on paper, so you can likely pull easier insights with pivot tables and a few customer interviews.
I realize this article went through a lot of different subjects relatively quickly, so if you still have questions or want help doing your own customer personas, comment below and I’ll answer to the best of my ability.
Related Posts
-

User flow is the path a user follows through your website interface to complete a…
-
Retention is the key to building a great business. When your core product experience brings…
-
Tommy evaluates Cheap Recipe Blog, and The Murray Group, an independent insurance agency out of Rochester…
-
What's user experience (UX) got to do with conversions? Everything. Great user experience is a…


Excellent Post. Clearly shows that marketers need to do this right or they are really wasting time and money.
Thanks Nash – I appreciate the comment
This is awesome. I’m not sure I’ve ever encountered a user person that I didn’t think was bull shit. Glad to see there is a way of doing it based on data and quantitative analysis rather than “this is who I think/want our customer is, I’ll just find a headshot of somebody and give them a name and call it a day”.
I’ve been wanting to build magazine reader personas for some time but knew it would be a huge endeavor. Alex, this outline is so dang helpful and I feel that the job is a lot less daunting. I can’t thank you enough for sharing. Great work!
Thanks – Best of luck building personas! During the process you’ll learn a ton about your customers whether the data comes out as clean as you’d like or not
GRREAT JOB; would like to see something simply on how to create insight from interviews and how to create insight from open ended questions in surveys / interviews.
Hey Roy – thanks! We have an article on open ended questions here: https://cxl.com/open-ended-questions/
There’s also a good book on the topic here: https://www.amazon.com/Talking-Humans-Success-understanding-customers-ebook/dp/B00NSUEUL4
Alex – great job. I have hated personas for years, thinking they were useless. Not with your approach, though.
And of course – you’re a Wisconsin grad. Makes total sense!
Thanks Fred – and go Badgers!
Hi Alex, great post and method! Could you share the questions you’ve used in your intial survey with me? Looking to do the same, and could need some inspiration! Thanks
Hey Lidia – here are some of the questions we used (worded differently of course, but shortened for the sake of brevity here):
Job title?
Current job level?
Company employee count?
Company revenue?
What type of company?
Most demanding skill for your job? (open ended)
Which software do you use most frequently for your job? (open ended)
How do you learn new skills/info? (scale, followed by a bunch of factors)
What publications do you read? (open ended)
Do you have an allotted training budget? (binary)
How important are the following factors when buying training? (scale, and a bunch of factors)
What was the last training you completed? (open)
Do you have employees that report to you? (binary)
Hey Alex! Excellent source for our site to start working with. Could you clarify: Whenever you performed k-means clustering, you only used quantitative data, didn’t you? Is there a way to carry out cluster analysis with qualitative answers?
Also, how do I approach building a user persona when I have multiselect (or check-all-that-apply) answers in questionnaires? Perhaps, listing all the answers per respondent and then codifying all the combinations could help?
yep, I only used quantitative variables, which of course is limiting in a way, but all the more reason to spend more time strategically planning your questions.
I’m super interested in how certain companies are solving the problem of unstructured data like qualitative insights, but I’m not sure there’s a really good solution out there now (let me know if you find one).
For the “check all that apply” I would separate each option into a separate variable and treat it as binary, like you would a yes or no question. Hope that helps!